29
/
en
AIzaSyAYiBZKx7MnpbEhh9jyipgxe19OcubqV5w
April 1, 2024
265194
Togo
TGO
true
2
1
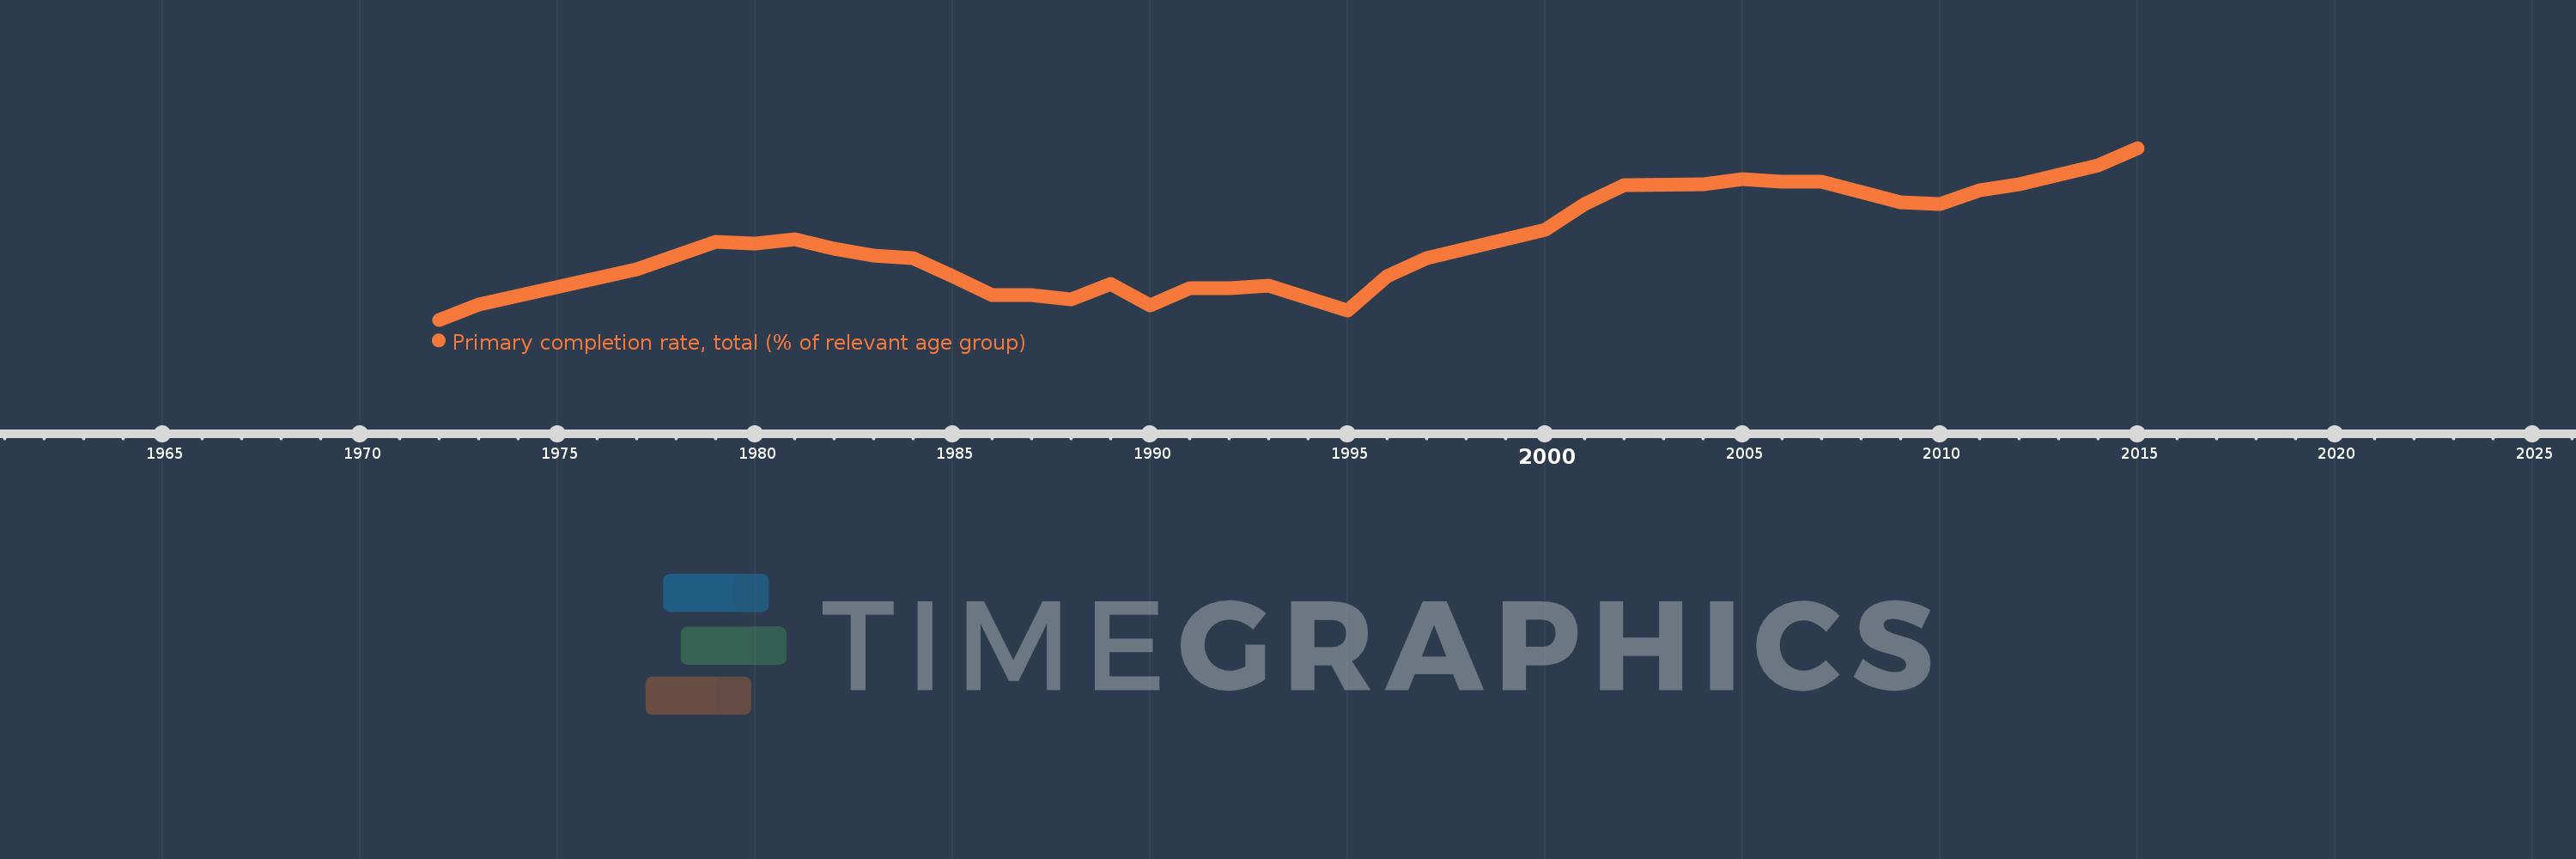
Primary completion rate, total (% of relevant age group)
2015,2014,2013,2012,2011,2010,2009,2007,2006,2005,2004,2002,2001,2000,1997,1996,1995,1993,1992,1991,1990,1989,1988,1987,1986,1985,1984,1983,1982,1981,1980,1979,1977,1973,1972
This statistics in other country:
AfghanistanAlbaniaAlgeriaAngolaAntigua and BarbudaArab WorldArgentinaArmeniaArubaAustriaAzerbaijanBahamas, TheBahrainBangladeshBarbadosBelarusBelgiumBelizeBeninBermudaBhutanBoliviaBosnia and HerzegovinaBotswanaBrazilBritish Virgin IslandsBrunei DarussalamBulgariaBurkina FasoBurundiCabo VerdeCambodiaCameroonCanadaCaribbean small statesCentral African RepublicCentral Europe and the BalticsChadChileChinaColombiaComorosCongo, Dem. Rep.Congo, Rep.Costa RicaCote d'IvoireCroatiaCubaCyprusCzech RepublicDenmarkDjiboutiDominicaDominican RepublicEarly-demographic dividendEast Asia & PacificEast Asia & Pacific (excluding high income)East Asia & Pacific (IDA & IBRD countries)EcuadorEgypt, Arab Rep.El SalvadorEquatorial GuineaEritreaEstoniaEthiopiaEuro areaEurope & Central AsiaEurope & Central Asia (excluding high income)Europe & Central Asia (IDA & IBRD countries)European UnionFijiFinlandFragile and conflict affected situationsFranceGabonGambia, TheGeorgiaGermanyGhanaGreeceGrenadaGuatemalaGuineaGuinea-BissauGuyanaHaitiHeavily indebted poor countries (HIPC)High incomeHondurasHong Kong SAR, ChinaHungaryIBRD onlyIcelandIDA & IBRD totalIDA blendIDA onlyIDA totalIndiaIndonesiaIran, Islamic Rep.IraqIrelandIsraelItalyJamaicaJapanJordanKazakhstanKenyaKiribatiKorea, Dem. People’s Rep.Korea, Rep.KuwaitKyrgyz RepublicLao PDRLate-demographic dividendLatin America & Caribbean Latin America & Caribbean (excluding high income)Latin America & the Caribbean (IDA & IBRD countries)LatviaLeast developed countries: UN classificationLebanonLesothoLiberiaLibyaLiechtensteinLithuaniaLow & middle incomeLow incomeLower middle incomeLuxembourgMacao SAR, ChinaMacedonia, FYRMadagascarMalawiMalaysiaMaldivesMaliMaltaMarshall IslandsMauritaniaMauritiusMexicoMiddle East & North AfricaMiddle East & North Africa (excluding high income)Middle East & North Africa (IDA & IBRD countries)Middle incomeMoldovaMongoliaMontenegroMoroccoMozambiqueMyanmarNamibiaNauruNepalNetherlandsNew ZealandNicaraguaNigerNigeriaNorwayOECD membersOmanOther small statesPacific island small statesPakistanPalauPanamaPapua New GuineaParaguayPeruPhilippinesPolandPortugalPost-demographic dividendPre-demographic dividendQatarRomaniaRussian FederationRwandaSamoaSan MarinoSao Tome and PrincipeSaudi ArabiaSenegalSerbiaSeychellesSierra LeoneSlovak RepublicSloveniaSmall statesSolomon IslandsSouth AfricaSouth AsiaSouth Asia (IDA & IBRD)South SudanSpainSri LankaSt. Kitts and NevisSt. LuciaSt. Vincent and the GrenadinesSub-Saharan Africa Sub-Saharan Africa (excluding high income)Sub-Saharan Africa (IDA & IBRD countries)SudanSurinameSwazilandSwedenSwitzerlandSyrian Arab RepublicTajikistanTanzaniaThailandTimor-LesteTogoTongaTrinidad and TobagoTunisiaTurkeyTuvaluUgandaUkraineUnited Arab EmiratesUpper middle incomeUruguayUzbekistanVanuatuVenezuela, RBVietnamWest Bank and GazaWorldYemen, Rep.ZambiaZimbabwe Timeline:
This timeline shows a graph from 1972 to 2015 of Togo. No data until 1971. Number of actual observations by date: 35.
Source name:
World Development Indicators
Source organization:
United Nations Educational, Scientific, and Cultural Organization (UNESCO) Institute for Statistics.
Categories, topics:
Aid Effectiveness, Climate Change, Education
Last updated:
apr 23, 2017
Indicators value changes by year
Minimum:
25.262
jan 1, 1972
Maximum:
85.108
jan 1, 2015
At the date of observation
Value
Absolute change
Change from previous value
jan 1, 1972
25.262
+25.262
0.0%
jan 1, 1973
30.578
+5.316
21.04%
jan 1, 1977
42.741
+12.163
39.78%
jan 1, 1979
52.314
+9.573
22.4%
jan 1, 1980
51.796
-0.518
-0.99%
jan 1, 1981
53.399
+1.603
3.09%
jan 1, 1982
50.063
-3.335
-6.25%
jan 1, 1983
47.706
-2.357
-4.71%
jan 1, 1984
46.684
-1.022
-2.14%
jan 1, 1985
40.293
-6.391
-13.69%
jan 1, 1986
33.935
-6.358
-15.78%
jan 1, 1987
33.706
-0.229
-0.67%
jan 1, 1988
32.357
-1.349
-4.0%
jan 1, 1989
37.592
+5.235
16.18%
jan 1, 1990
30.384
-7.208
-19.17%
jan 1, 1991
36.379
+5.995
19.73%
jan 1, 1992
36.384
+0.006
0.02%
jan 1, 1993
37.106
+0.722
1.98%
jan 1, 1995
28.384
-8.722
-23.5%
jan 1, 1996
40.316
+11.931
42.03%
jan 1, 1997
46.86
+6.544
16.23%
jan 1, 2000
56.457
+9.597
20.48%
jan 1, 2001
65.436
+8.979
15.9%
jan 1, 2002
72.135
+6.698
10.24%
jan 1, 2004
72.445
+0.31
0.43%
jan 1, 2005
74.176
+1.731
2.39%
jan 1, 2006
73.459
-0.717
-0.97%
jan 1, 2007
73.28
-0.179
-0.24%
jan 1, 2009
66.233
-7.047
-9.62%
jan 1, 2010
65.702
-0.532
-0.8%
jan 1, 2011
70.47
+4.768
7.26%
jan 1, 2012
72.336
+1.866
2.65%
jan 1, 2013
75.715
+3.379
4.67%
jan 1, 2014
79.089
+3.374
4.46%
jan 1, 2015
85.108
+6.02
7.61%
Ranking of countries by current statistics by years


Comments: