29
/
en
AIzaSyAYiBZKx7MnpbEhh9jyipgxe19OcubqV5w
April 1, 2024
165452
Jordan
JOR
true
2
1
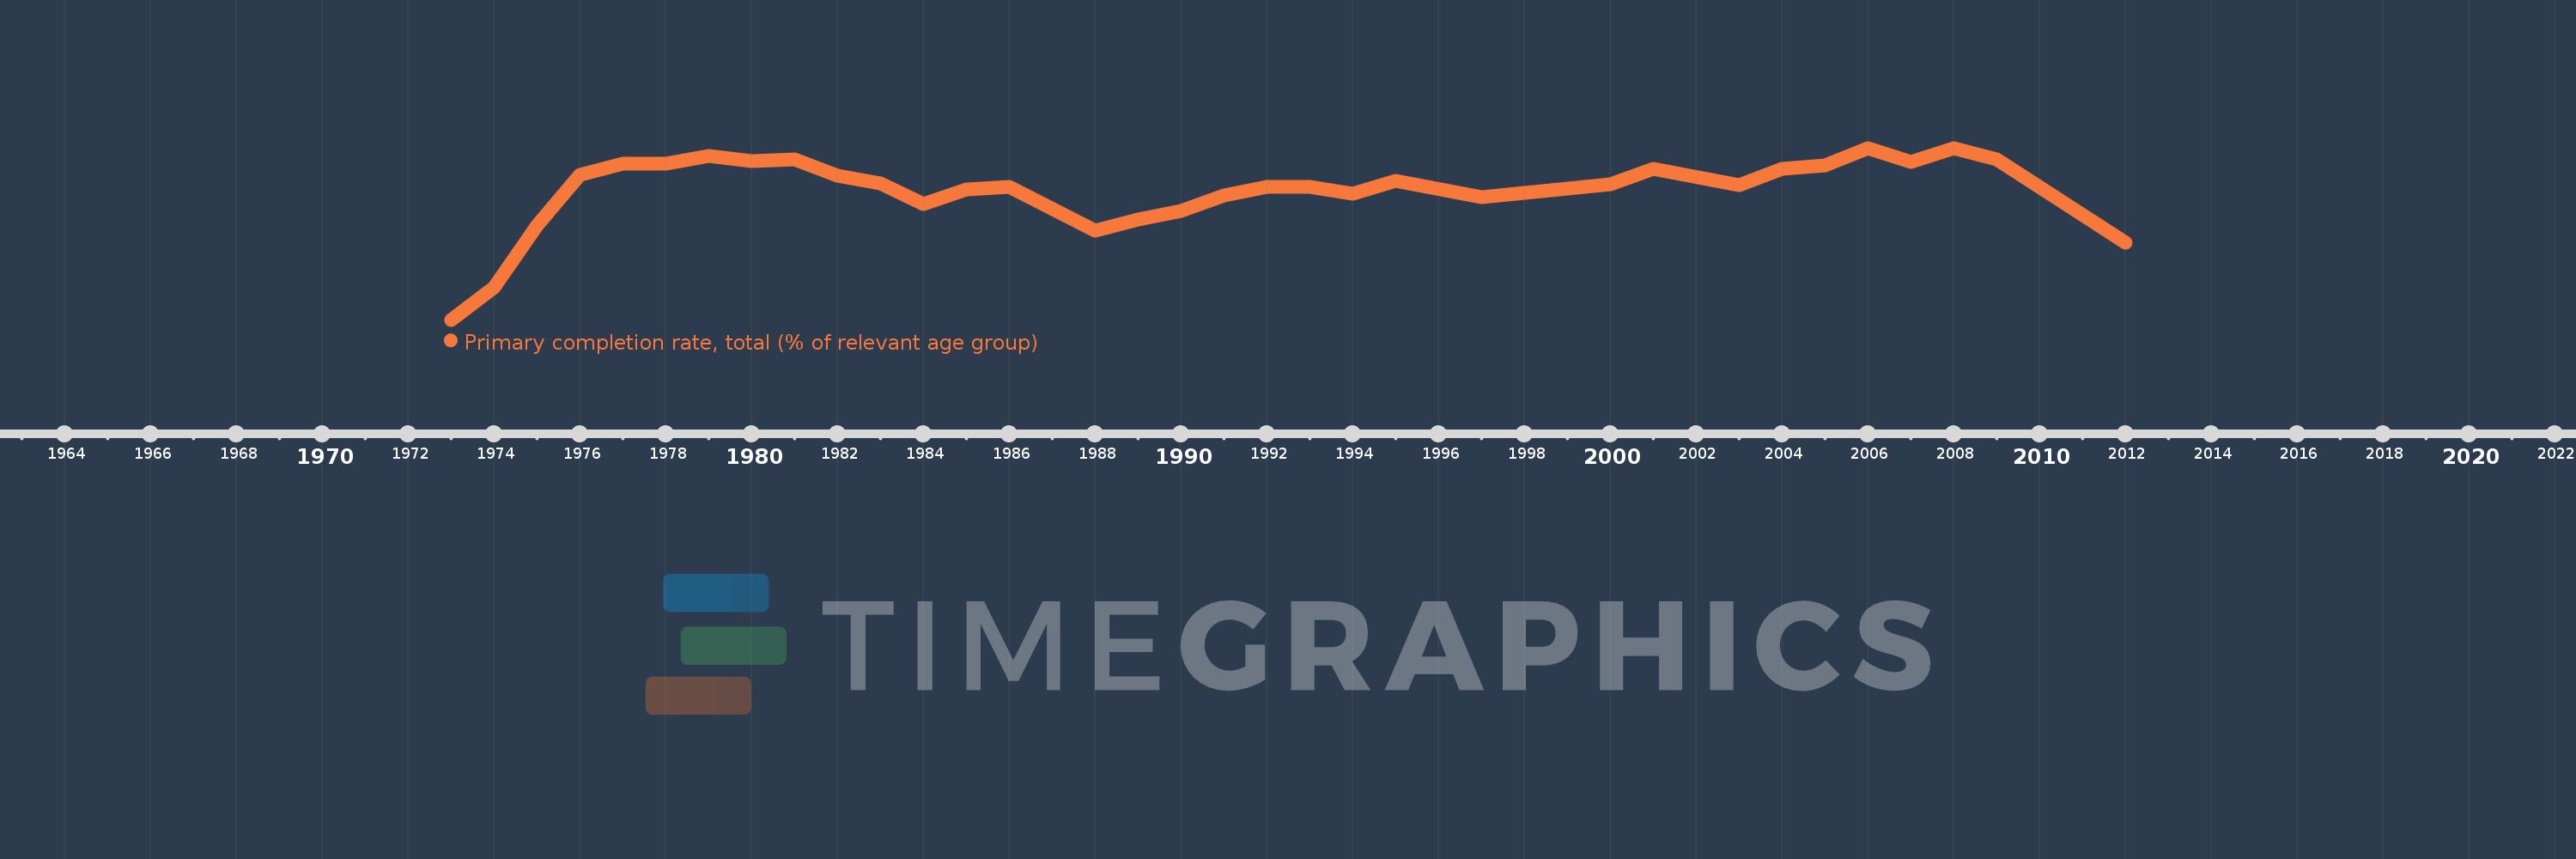
Primary completion rate, total (% of relevant age group)
2012,2009,2008,2007,2006,2005,2004,2003,2001,2000,1997,1995,1994,1993,1992,1991,1990,1989,1988,1986,1985,1984,1983,1982,1981,1980,1979,1978,1977,1976,1975,1974,1973
This statistics in other country:
AfghanistanAlbaniaAlgeriaAngolaAntigua and BarbudaArab WorldArgentinaArmeniaArubaAustriaAzerbaijanBahamas, TheBahrainBangladeshBarbadosBelarusBelgiumBelizeBeninBermudaBhutanBoliviaBosnia and HerzegovinaBotswanaBrazilBritish Virgin IslandsBrunei DarussalamBulgariaBurkina FasoBurundiCabo VerdeCambodiaCameroonCanadaCaribbean small statesCentral African RepublicCentral Europe and the BalticsChadChileChinaColombiaComorosCongo, Dem. Rep.Congo, Rep.Costa RicaCote d'IvoireCroatiaCubaCyprusCzech RepublicDenmarkDjiboutiDominicaDominican RepublicEarly-demographic dividendEast Asia & PacificEast Asia & Pacific (excluding high income)East Asia & Pacific (IDA & IBRD countries)EcuadorEgypt, Arab Rep.El SalvadorEquatorial GuineaEritreaEstoniaEthiopiaEuro areaEurope & Central AsiaEurope & Central Asia (excluding high income)Europe & Central Asia (IDA & IBRD countries)European UnionFijiFinlandFragile and conflict affected situationsFranceGabonGambia, TheGeorgiaGermanyGhanaGreeceGrenadaGuatemalaGuineaGuinea-BissauGuyanaHaitiHeavily indebted poor countries (HIPC)High incomeHondurasHong Kong SAR, ChinaHungaryIBRD onlyIcelandIDA & IBRD totalIDA blendIDA onlyIDA totalIndiaIndonesiaIran, Islamic Rep.IraqIrelandIsraelItalyJamaicaJapanJordanKazakhstanKenyaKiribatiKorea, Dem. People’s Rep.Korea, Rep.KuwaitKyrgyz RepublicLao PDRLate-demographic dividendLatin America & Caribbean Latin America & Caribbean (excluding high income)Latin America & the Caribbean (IDA & IBRD countries)LatviaLeast developed countries: UN classificationLebanonLesothoLiberiaLibyaLiechtensteinLithuaniaLow & middle incomeLow incomeLower middle incomeLuxembourgMacao SAR, ChinaMacedonia, FYRMadagascarMalawiMalaysiaMaldivesMaliMaltaMarshall IslandsMauritaniaMauritiusMexicoMiddle East & North AfricaMiddle East & North Africa (excluding high income)Middle East & North Africa (IDA & IBRD countries)Middle incomeMoldovaMongoliaMontenegroMoroccoMozambiqueMyanmarNamibiaNauruNepalNetherlandsNew ZealandNicaraguaNigerNigeriaNorwayOECD membersOmanOther small statesPacific island small statesPakistanPalauPanamaPapua New GuineaParaguayPeruPhilippinesPolandPortugalPost-demographic dividendPre-demographic dividendQatarRomaniaRussian FederationRwandaSamoaSan MarinoSao Tome and PrincipeSaudi ArabiaSenegalSerbiaSeychellesSierra LeoneSlovak RepublicSloveniaSmall statesSolomon IslandsSouth AfricaSouth AsiaSouth Asia (IDA & IBRD)South SudanSpainSri LankaSt. Kitts and NevisSt. LuciaSt. Vincent and the GrenadinesSub-Saharan Africa Sub-Saharan Africa (excluding high income)Sub-Saharan Africa (IDA & IBRD countries)SudanSurinameSwazilandSwedenSwitzerlandSyrian Arab RepublicTajikistanTanzaniaThailandTimor-LesteTogoTongaTrinidad and TobagoTunisiaTurkeyTuvaluUgandaUkraineUnited Arab EmiratesUpper middle incomeUruguayUzbekistanVanuatuVenezuela, RBVietnamWest Bank and GazaWorldYemen, Rep.ZambiaZimbabwe Timeline:
This timeline shows a graph from 1973 to 2012 of Jordan. No data until 1972. Number of actual observations by date: 33.
Source name:
World Development Indicators
Source organization:
United Nations Educational, Scientific, and Cultural Organization (UNESCO) Institute for Statistics.
Categories, topics:
Aid Effectiveness, Climate Change, Education
Last updated:
apr 23, 2017
Indicators value changes by year
Minimum:
70.251
jan 1, 1973
Maximum:
105.479
jan 1, 2006
At the date of observation
Value
Absolute change
Change from previous value
jan 1, 1973
70.251
+70.251
0.0%
jan 1, 1974
76.838
+6.587
9.38%
jan 1, 1975
89.59
+12.752
16.6%
jan 1, 1976
99.937
+10.347
11.55%
jan 1, 1977
102.179
+2.242
2.24%
jan 1, 1978
102.179
-0.001
0.0%
jan 1, 1979
103.913
+1.734
1.7%
jan 1, 1980
102.809
-1.104
-1.06%
jan 1, 1981
103.113
+0.304
0.3%
jan 1, 1982
99.753
-3.361
-3.26%
jan 1, 1983
98.119
-1.633
-1.64%
jan 1, 1984
93.956
-4.164
-4.24%
jan 1, 1985
96.975
+3.02
3.21%
jan 1, 1986
97.447
+0.472
0.49%
jan 1, 1988
88.462
-8.985
-9.22%
jan 1, 1989
90.772
+2.31
2.61%
jan 1, 1990
92.573
+1.801
1.98%
jan 1, 1991
95.7
+3.127
3.38%
jan 1, 1992
97.577
+1.878
1.96%
jan 1, 1993
97.453
-0.124
-0.13%
jan 1, 1994
96.062
-1.391
-1.43%
jan 1, 1995
98.754
+2.692
2.8%
jan 1, 1997
95.459
-3.294
-3.34%
jan 1, 2000
97.957
+2.497
2.62%
jan 1, 2001
101.162
+3.206
3.27%
jan 1, 2003
97.87
-3.292
-3.25%
jan 1, 2004
101.131
+3.26
3.33%
jan 1, 2005
101.928
+0.798
0.79%
jan 1, 2006
105.479
+3.551
3.48%
jan 1, 2007
102.628
-2.851
-2.7%
jan 1, 2008
105.339
+2.711
2.64%
jan 1, 2009
103.068
-2.272
-2.16%
jan 1, 2012
85.98
-17.088
-16.58%
Ranking of countries by current statistics by years


Comments: