29
/
en
AIzaSyAYiBZKx7MnpbEhh9jyipgxe19OcubqV5w
April 1, 2024
102977
Central African Republic
CAF
true
2
1
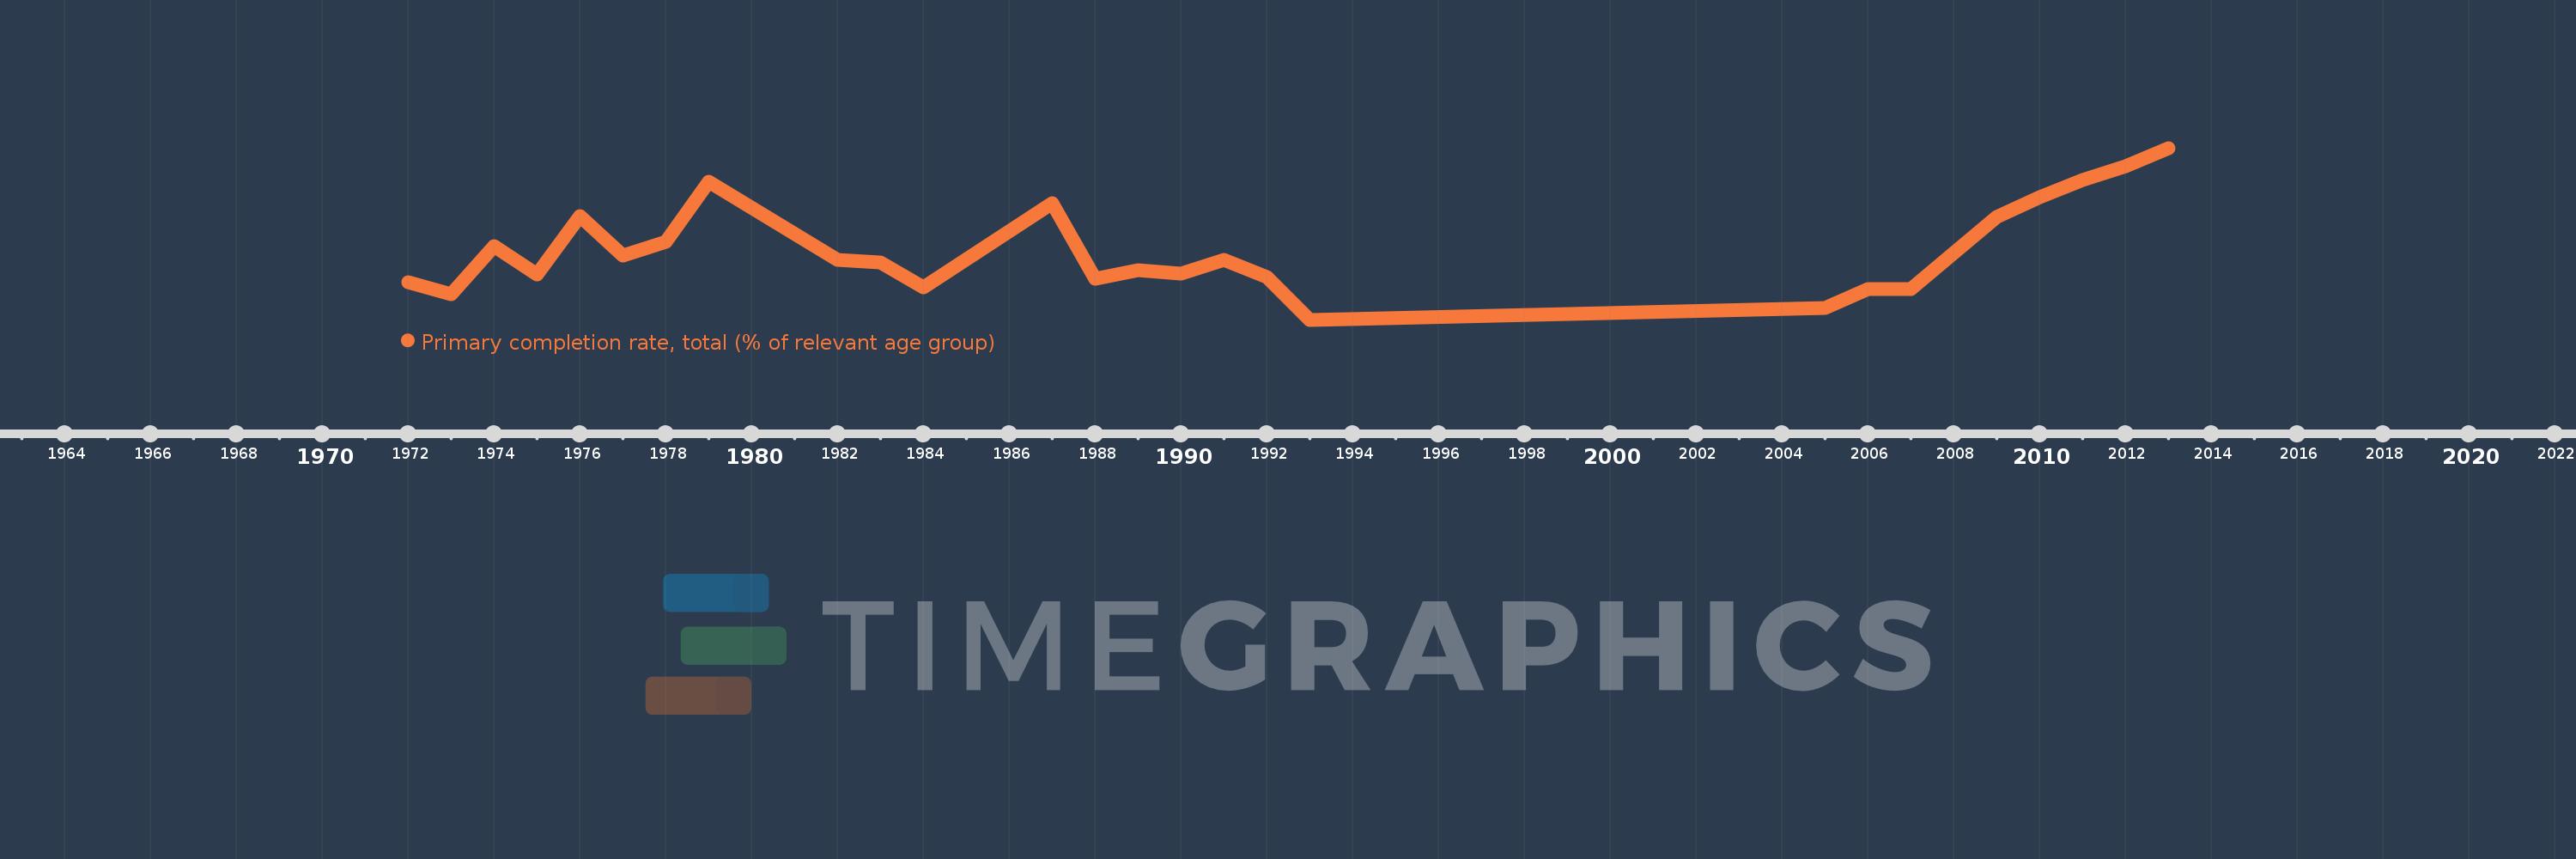
Primary completion rate, total (% of relevant age group)
2013,2012,2011,2010,2009,2007,2006,2005,1993,1992,1991,1990,1989,1988,1987,1984,1983,1982,1979,1978,1977,1976,1975,1974,1973,1972
This statistics in other country:
AfghanistanAlbaniaAlgeriaAngolaAntigua and BarbudaArab WorldArgentinaArmeniaArubaAustriaAzerbaijanBahamas, TheBahrainBangladeshBarbadosBelarusBelgiumBelizeBeninBermudaBhutanBoliviaBosnia and HerzegovinaBotswanaBrazilBritish Virgin IslandsBrunei DarussalamBulgariaBurkina FasoBurundiCabo VerdeCambodiaCameroonCanadaCaribbean small statesCentral African RepublicCentral Europe and the BalticsChadChileChinaColombiaComorosCongo, Dem. Rep.Congo, Rep.Costa RicaCote d'IvoireCroatiaCubaCyprusCzech RepublicDenmarkDjiboutiDominicaDominican RepublicEarly-demographic dividendEast Asia & PacificEast Asia & Pacific (excluding high income)East Asia & Pacific (IDA & IBRD countries)EcuadorEgypt, Arab Rep.El SalvadorEquatorial GuineaEritreaEstoniaEthiopiaEuro areaEurope & Central AsiaEurope & Central Asia (excluding high income)Europe & Central Asia (IDA & IBRD countries)European UnionFijiFinlandFragile and conflict affected situationsFranceGabonGambia, TheGeorgiaGermanyGhanaGreeceGrenadaGuatemalaGuineaGuinea-BissauGuyanaHaitiHeavily indebted poor countries (HIPC)High incomeHondurasHong Kong SAR, ChinaHungaryIBRD onlyIcelandIDA & IBRD totalIDA blendIDA onlyIDA totalIndiaIndonesiaIran, Islamic Rep.IraqIrelandIsraelItalyJamaicaJapanJordanKazakhstanKenyaKiribatiKorea, Dem. People’s Rep.Korea, Rep.KuwaitKyrgyz RepublicLao PDRLate-demographic dividendLatin America & Caribbean Latin America & Caribbean (excluding high income)Latin America & the Caribbean (IDA & IBRD countries)LatviaLeast developed countries: UN classificationLebanonLesothoLiberiaLibyaLiechtensteinLithuaniaLow & middle incomeLow incomeLower middle incomeLuxembourgMacao SAR, ChinaMacedonia, FYRMadagascarMalawiMalaysiaMaldivesMaliMaltaMarshall IslandsMauritaniaMauritiusMexicoMiddle East & North AfricaMiddle East & North Africa (excluding high income)Middle East & North Africa (IDA & IBRD countries)Middle incomeMoldovaMongoliaMontenegroMoroccoMozambiqueMyanmarNamibiaNauruNepalNetherlandsNew ZealandNicaraguaNigerNigeriaNorwayOECD membersOmanOther small statesPacific island small statesPakistanPalauPanamaPapua New GuineaParaguayPeruPhilippinesPolandPortugalPost-demographic dividendPre-demographic dividendQatarRomaniaRussian FederationRwandaSamoaSan MarinoSao Tome and PrincipeSaudi ArabiaSenegalSerbiaSeychellesSierra LeoneSlovak RepublicSloveniaSmall statesSolomon IslandsSouth AfricaSouth AsiaSouth Asia (IDA & IBRD)South SudanSpainSri LankaSt. Kitts and NevisSt. LuciaSt. Vincent and the GrenadinesSub-Saharan Africa Sub-Saharan Africa (excluding high income)Sub-Saharan Africa (IDA & IBRD countries)SudanSurinameSwazilandSwedenSwitzerlandSyrian Arab RepublicTajikistanTanzaniaThailandTimor-LesteTogoTongaTrinidad and TobagoTunisiaTurkeyTuvaluUgandaUkraineUnited Arab EmiratesUpper middle incomeUruguayUzbekistanVanuatuVenezuela, RBVietnamWest Bank and GazaWorldYemen, Rep.ZambiaZimbabwe Timeline:
This timeline shows a graph from 1972 to 2013 of Central African Republic. No data until 1971. Number of actual observations by date: 26.
Source name:
World Development Indicators
Source organization:
United Nations Educational, Scientific, and Cultural Organization (UNESCO) Institute for Statistics.
Categories, topics:
Aid Effectiveness, Climate Change, Education
Last updated:
apr 23, 2017
Indicators value changes by year
Minimum:
22.505
jan 1, 1993
Maximum:
44.423
jan 1, 2013
At the date of observation
Value
Absolute change
Change from previous value
jan 1, 1972
27.331
+27.331
0.0%
jan 1, 1973
25.736
-1.595
-5.84%
jan 1, 1974
31.936
+6.2
24.09%
jan 1, 1975
28.236
-3.7
-11.58%
jan 1, 1976
35.774
+7.538
26.69%
jan 1, 1977
30.732
-5.041
-14.09%
jan 1, 1978
32.477
+1.745
5.68%
jan 1, 1979
40.127
+7.65
23.55%
jan 1, 1982
30.13
-9.997
-24.91%
jan 1, 1983
29.795
-0.335
-1.11%
jan 1, 1984
26.595
-3.2
-10.74%
jan 1, 1987
37.379
+10.784
40.55%
jan 1, 1988
27.767
-9.612
-25.71%
jan 1, 1989
28.823
+1.055
3.8%
jan 1, 1990
28.389
-0.433
-1.5%
jan 1, 1991
30.172
+1.783
6.28%
jan 1, 1992
27.989
-2.183
-7.23%
jan 1, 1993
22.505
-5.484
-19.59%
jan 1, 2005
24.029
+1.524
6.77%
jan 1, 2006
26.414
+2.384
9.92%
jan 1, 2007
26.461
+0.047
0.18%
jan 1, 2009
35.57
+9.109
34.42%
jan 1, 2010
38.167
+2.597
7.3%
jan 1, 2011
40.32
+2.153
5.64%
jan 1, 2012
42.12
+1.8
4.46%
jan 1, 2013
44.423
+2.303
5.47%
Ranking of countries by current statistics by years


Comments: