29
/
en
AIzaSyAYiBZKx7MnpbEhh9jyipgxe19OcubqV5w
April 1, 2024
225311
Poland
POL
true
2
1
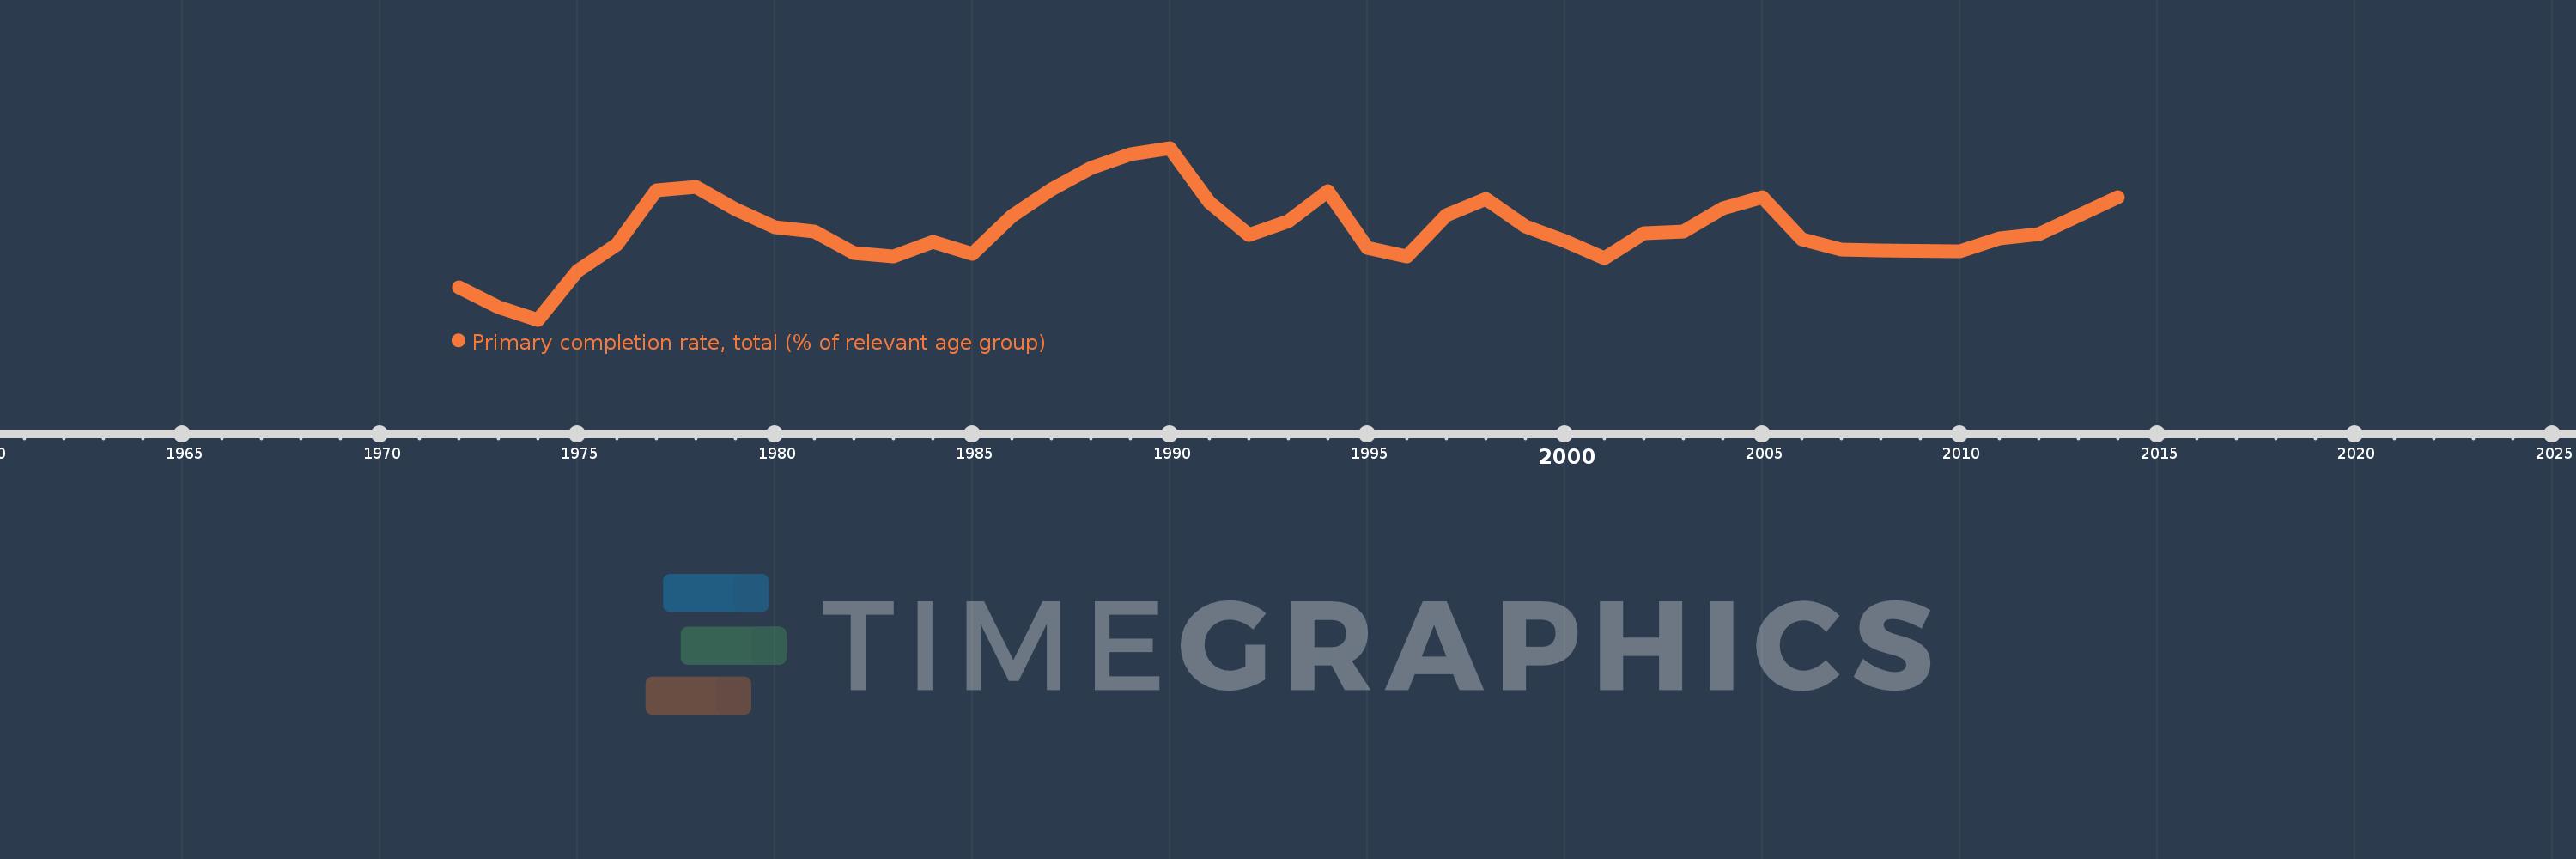
Primary completion rate, total (% of relevant age group)
2014,2012,2011,2010,2008,2007,2006,2005,2004,2003,2002,2001,2000,1999,1998,1997,1996,1995,1994,1993,1992,1991,1990,1989,1988,1987,1986,1985,1984,1983,1982,1981,1980,1979,1978,1977,1976,1975,1974,1973,1972
This statistics in other country:
AfghanistanAlbaniaAlgeriaAngolaAntigua and BarbudaArab WorldArgentinaArmeniaArubaAustriaAzerbaijanBahamas, TheBahrainBangladeshBarbadosBelarusBelgiumBelizeBeninBermudaBhutanBoliviaBosnia and HerzegovinaBotswanaBrazilBritish Virgin IslandsBrunei DarussalamBulgariaBurkina FasoBurundiCabo VerdeCambodiaCameroonCanadaCaribbean small statesCentral African RepublicCentral Europe and the BalticsChadChileChinaColombiaComorosCongo, Dem. Rep.Congo, Rep.Costa RicaCote d'IvoireCroatiaCubaCyprusCzech RepublicDenmarkDjiboutiDominicaDominican RepublicEarly-demographic dividendEast Asia & PacificEast Asia & Pacific (excluding high income)East Asia & Pacific (IDA & IBRD countries)EcuadorEgypt, Arab Rep.El SalvadorEquatorial GuineaEritreaEstoniaEthiopiaEuro areaEurope & Central AsiaEurope & Central Asia (excluding high income)Europe & Central Asia (IDA & IBRD countries)European UnionFijiFinlandFragile and conflict affected situationsFranceGabonGambia, TheGeorgiaGermanyGhanaGreeceGrenadaGuatemalaGuineaGuinea-BissauGuyanaHaitiHeavily indebted poor countries (HIPC)High incomeHondurasHong Kong SAR, ChinaHungaryIBRD onlyIcelandIDA & IBRD totalIDA blendIDA onlyIDA totalIndiaIndonesiaIran, Islamic Rep.IraqIrelandIsraelItalyJamaicaJapanJordanKazakhstanKenyaKiribatiKorea, Dem. People’s Rep.Korea, Rep.KuwaitKyrgyz RepublicLao PDRLate-demographic dividendLatin America & Caribbean Latin America & Caribbean (excluding high income)Latin America & the Caribbean (IDA & IBRD countries)LatviaLeast developed countries: UN classificationLebanonLesothoLiberiaLibyaLiechtensteinLithuaniaLow & middle incomeLow incomeLower middle incomeLuxembourgMacao SAR, ChinaMacedonia, FYRMadagascarMalawiMalaysiaMaldivesMaliMaltaMarshall IslandsMauritaniaMauritiusMexicoMiddle East & North AfricaMiddle East & North Africa (excluding high income)Middle East & North Africa (IDA & IBRD countries)Middle incomeMoldovaMongoliaMontenegroMoroccoMozambiqueMyanmarNamibiaNauruNepalNetherlandsNew ZealandNicaraguaNigerNigeriaNorwayOECD membersOmanOther small statesPacific island small statesPakistanPalauPanamaPapua New GuineaParaguayPeruPhilippinesPolandPortugalPost-demographic dividendPre-demographic dividendQatarRomaniaRussian FederationRwandaSamoaSan MarinoSao Tome and PrincipeSaudi ArabiaSenegalSerbiaSeychellesSierra LeoneSlovak RepublicSloveniaSmall statesSolomon IslandsSouth AfricaSouth AsiaSouth Asia (IDA & IBRD)South SudanSpainSri LankaSt. Kitts and NevisSt. LuciaSt. Vincent and the GrenadinesSub-Saharan Africa Sub-Saharan Africa (excluding high income)Sub-Saharan Africa (IDA & IBRD countries)SudanSurinameSwazilandSwedenSwitzerlandSyrian Arab RepublicTajikistanTanzaniaThailandTimor-LesteTogoTongaTrinidad and TobagoTunisiaTurkeyTuvaluUgandaUkraineUnited Arab EmiratesUpper middle incomeUruguayUzbekistanVanuatuVenezuela, RBVietnamWest Bank and GazaWorldYemen, Rep.ZambiaZimbabwe Timeline:
This timeline shows a graph from 1972 to 2014 of Poland. No data until 1971. Number of actual observations by date: 41.
Source name:
World Development Indicators
Source organization:
United Nations Educational, Scientific, and Cultural Organization (UNESCO) Institute for Statistics.
Categories, topics:
Aid Effectiveness, Climate Change, Education
Last updated:
apr 23, 2017
Indicators value changes by year
Minimum:
90.199
jan 1, 1974
Maximum:
101.316
jan 1, 1990
At the date of observation
Value
Absolute change
Change from previous value
jan 1, 1972
92.294
+92.294
0.0%
jan 1, 1973
91.01
-1.284
-1.39%
jan 1, 1974
90.199
-0.811
-0.89%
jan 1, 1975
93.359
+3.16
3.5%
jan 1, 1976
95.073
+1.714
1.84%
jan 1, 1977
98.577
+3.504
3.69%
jan 1, 1978
98.778
+0.201
0.2%
jan 1, 1979
97.353
-1.425
-1.44%
jan 1, 1980
96.199
-1.154
-1.19%
jan 1, 1981
95.889
-0.31
-0.32%
jan 1, 1982
94.517
-1.372
-1.43%
jan 1, 1983
94.313
-0.205
-0.22%
jan 1, 1984
95.268
+0.955
1.01%
jan 1, 1985
94.458
-0.81
-0.85%
jan 1, 1986
96.887
+2.429
2.57%
jan 1, 1987
98.639
+1.752
1.81%
jan 1, 1988
100.001
+1.363
1.38%
jan 1, 1989
100.918
+0.917
0.92%
jan 1, 1990
101.316
+0.398
0.39%
jan 1, 1991
97.783
-3.534
-3.49%
jan 1, 1992
95.711
-2.071
-2.12%
jan 1, 1993
96.601
+0.89
0.93%
jan 1, 1994
98.544
+1.943
2.01%
jan 1, 1995
94.87
-3.674
-3.73%
jan 1, 1996
94.276
-0.595
-0.63%
jan 1, 1997
96.971
+2.695
2.86%
jan 1, 1998
98.018
+1.047
1.08%
jan 1, 1999
96.215
-1.802
-1.84%
jan 1, 2000
95.286
-0.93
-0.97%
jan 1, 2001
94.166
-1.12
-1.18%
jan 1, 2002
95.809
+1.644
1.75%
jan 1, 2003
95.9
+0.091
0.09%
jan 1, 2004
97.388
+1.488
1.55%
jan 1, 2005
98.111
+0.723
0.74%
jan 1, 2006
95.384
-2.727
-2.78%
jan 1, 2007
94.719
-0.665
-0.7%
jan 1, 2008
94.676
-0.043
-0.04%
jan 1, 2010
94.654
-0.022
-0.02%
jan 1, 2011
95.451
+0.797
0.84%
jan 1, 2012
95.719
+0.268
0.28%
jan 1, 2014
98.133
+2.414
2.52%
Ranking of countries by current statistics by years


Comments: