29
/
en
AIzaSyAYiBZKx7MnpbEhh9jyipgxe19OcubqV5w
April 1, 2024
215733
Oman
OMN
true
2
1
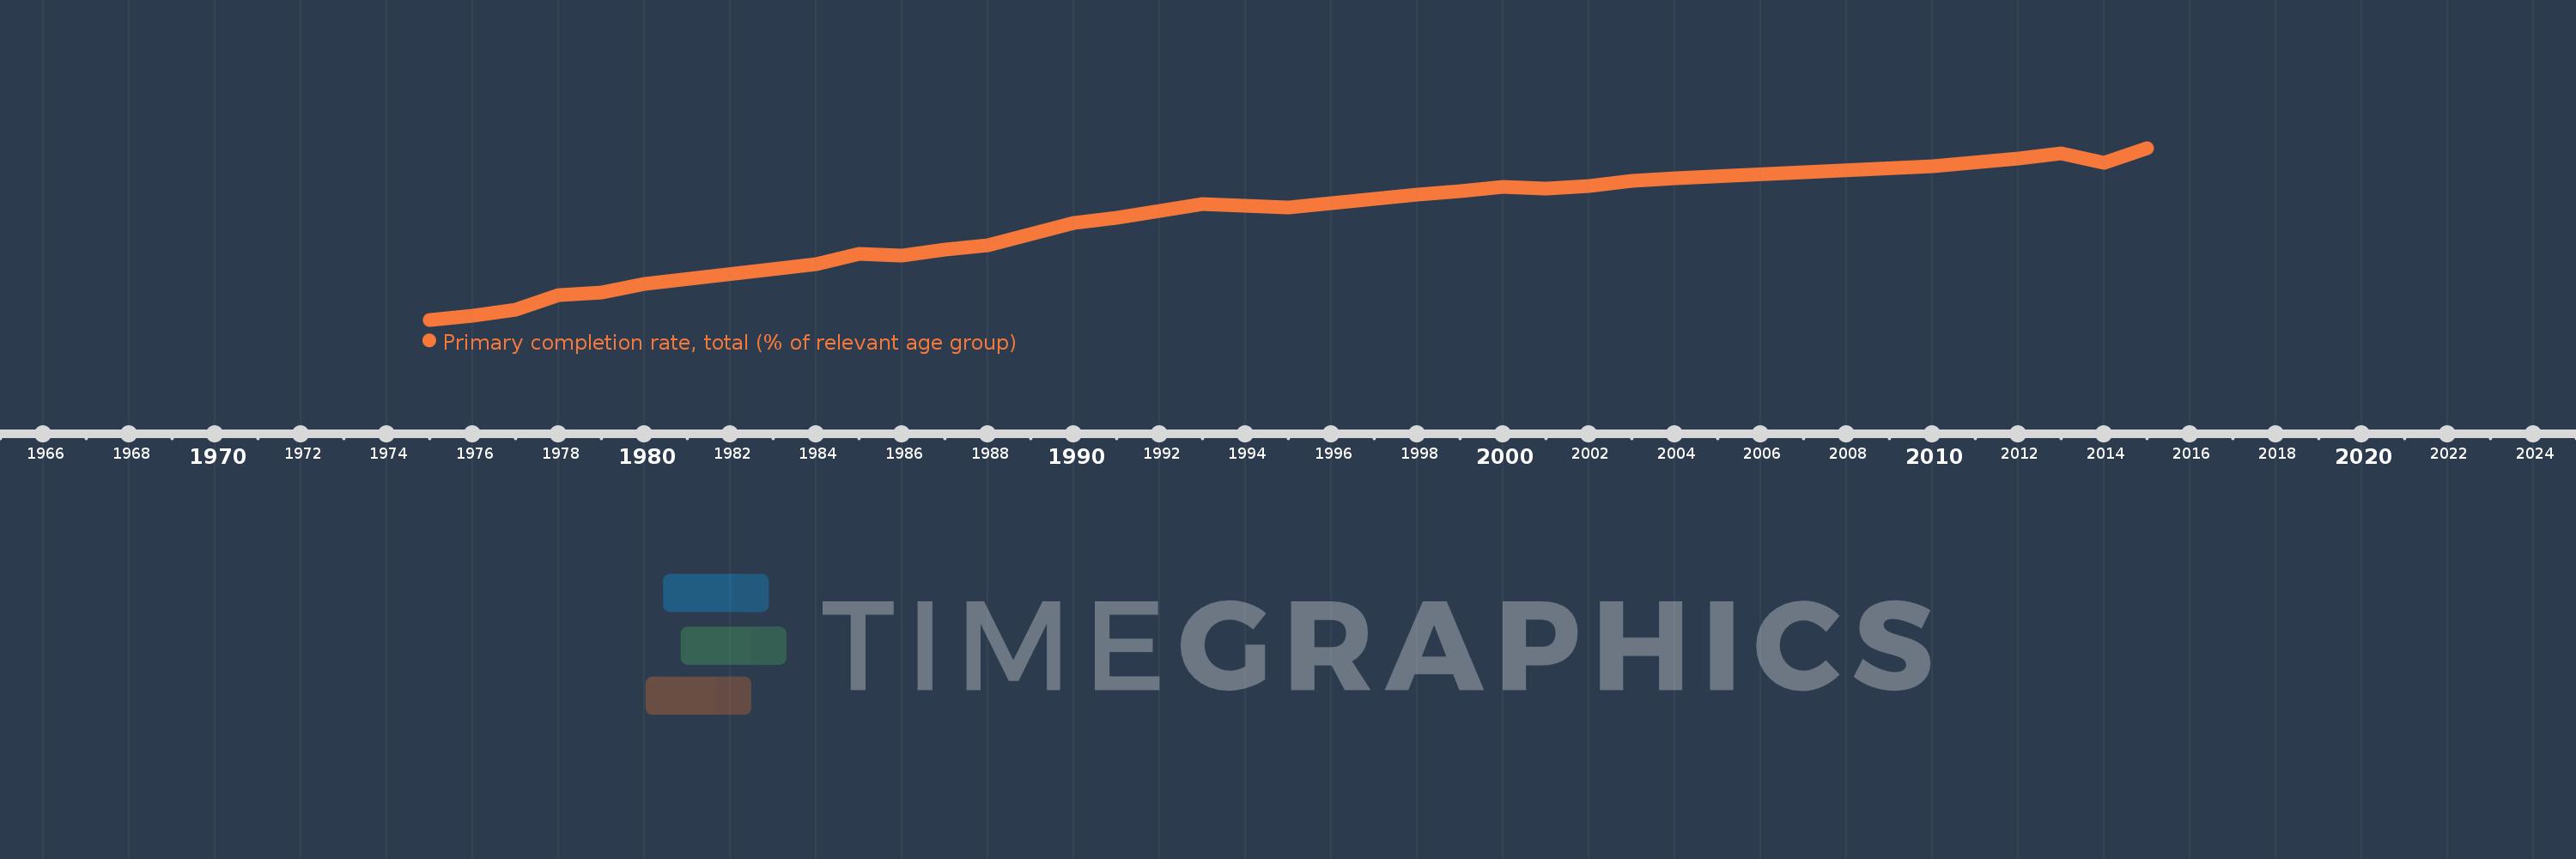
Primary completion rate, total (% of relevant age group)
2015,2014,2013,2012,2010,2004,2003,2002,2001,2000,1999,1998,1997,1996,1995,1993,1991,1990,1989,1988,1987,1986,1985,1984,1980,1979,1978,1977,1976,1975
This statistics in other country:
AfghanistanAlbaniaAlgeriaAngolaAntigua and BarbudaArab WorldArgentinaArmeniaArubaAustriaAzerbaijanBahamas, TheBahrainBangladeshBarbadosBelarusBelgiumBelizeBeninBermudaBhutanBoliviaBosnia and HerzegovinaBotswanaBrazilBritish Virgin IslandsBrunei DarussalamBulgariaBurkina FasoBurundiCabo VerdeCambodiaCameroonCanadaCaribbean small statesCentral African RepublicCentral Europe and the BalticsChadChileChinaColombiaComorosCongo, Dem. Rep.Congo, Rep.Costa RicaCote d'IvoireCroatiaCubaCyprusCzech RepublicDenmarkDjiboutiDominicaDominican RepublicEarly-demographic dividendEast Asia & PacificEast Asia & Pacific (excluding high income)East Asia & Pacific (IDA & IBRD countries)EcuadorEgypt, Arab Rep.El SalvadorEquatorial GuineaEritreaEstoniaEthiopiaEuro areaEurope & Central AsiaEurope & Central Asia (excluding high income)Europe & Central Asia (IDA & IBRD countries)European UnionFijiFinlandFragile and conflict affected situationsFranceGabonGambia, TheGeorgiaGermanyGhanaGreeceGrenadaGuatemalaGuineaGuinea-BissauGuyanaHaitiHeavily indebted poor countries (HIPC)High incomeHondurasHong Kong SAR, ChinaHungaryIBRD onlyIcelandIDA & IBRD totalIDA blendIDA onlyIDA totalIndiaIndonesiaIran, Islamic Rep.IraqIrelandIsraelItalyJamaicaJapanJordanKazakhstanKenyaKiribatiKorea, Dem. People’s Rep.Korea, Rep.KuwaitKyrgyz RepublicLao PDRLate-demographic dividendLatin America & Caribbean Latin America & Caribbean (excluding high income)Latin America & the Caribbean (IDA & IBRD countries)LatviaLeast developed countries: UN classificationLebanonLesothoLiberiaLibyaLiechtensteinLithuaniaLow & middle incomeLow incomeLower middle incomeLuxembourgMacao SAR, ChinaMacedonia, FYRMadagascarMalawiMalaysiaMaldivesMaliMaltaMarshall IslandsMauritaniaMauritiusMexicoMiddle East & North AfricaMiddle East & North Africa (excluding high income)Middle East & North Africa (IDA & IBRD countries)Middle incomeMoldovaMongoliaMontenegroMoroccoMozambiqueMyanmarNamibiaNauruNepalNetherlandsNew ZealandNicaraguaNigerNigeriaNorwayOECD membersOmanOther small statesPacific island small statesPakistanPalauPanamaPapua New GuineaParaguayPeruPhilippinesPolandPortugalPost-demographic dividendPre-demographic dividendQatarRomaniaRussian FederationRwandaSamoaSan MarinoSao Tome and PrincipeSaudi ArabiaSenegalSerbiaSeychellesSierra LeoneSlovak RepublicSloveniaSmall statesSolomon IslandsSouth AfricaSouth AsiaSouth Asia (IDA & IBRD)South SudanSpainSri LankaSt. Kitts and NevisSt. LuciaSt. Vincent and the GrenadinesSub-Saharan Africa Sub-Saharan Africa (excluding high income)Sub-Saharan Africa (IDA & IBRD countries)SudanSurinameSwazilandSwedenSwitzerlandSyrian Arab RepublicTajikistanTanzaniaThailandTimor-LesteTogoTongaTrinidad and TobagoTunisiaTurkeyTuvaluUgandaUkraineUnited Arab EmiratesUpper middle incomeUruguayUzbekistanVanuatuVenezuela, RBVietnamWest Bank and GazaWorldYemen, Rep.ZambiaZimbabwe Timeline:
This timeline shows a graph from 1975 to 2015 of Oman. No data until 1974. Number of actual observations by date: 30.
Source name:
World Development Indicators
Source organization:
United Nations Educational, Scientific, and Cultural Organization (UNESCO) Institute for Statistics.
Categories, topics:
Aid Effectiveness, Climate Change, Education
Last updated:
apr 23, 2017
Indicators value changes by year
Maximum:
108.813
jan 1, 2015
At the date of observation
Value
Absolute change
Change from previous value
jan 1, 1975
1.522
+1.522
0.0%
jan 1, 1976
4.235
+2.713
178.28%
jan 1, 1977
7.621
+3.386
79.94%
jan 1, 1978
16.822
+9.201
120.73%
jan 1, 1979
18.289
+1.466
8.72%
jan 1, 1980
23.84
+5.551
30.35%
jan 1, 1984
36.406
+12.566
52.71%
jan 1, 1985
42.66
+6.254
17.18%
jan 1, 1986
41.838
-0.822
-1.93%
jan 1, 1987
45.463
+3.625
8.66%
jan 1, 1988
48.021
+2.558
5.63%
jan 1, 1989
54.743
+6.722
14.0%
jan 1, 1990
61.891
+7.148
13.06%
jan 1, 1991
65.042
+3.151
5.09%
jan 1, 1993
73.881
+8.839
13.59%
jan 1, 1995
71.719
-2.163
-2.93%
jan 1, 1996
74.209
+2.49
3.47%
jan 1, 1997
76.854
+2.645
3.56%
jan 1, 1998
79.56
+2.706
3.52%
jan 1, 1999
82.01
+2.45
3.08%
jan 1, 2000
84.419
+2.409
2.94%
jan 1, 2001
83.459
-0.96
-1.14%
jan 1, 2002
84.953
+1.494
1.79%
jan 1, 2003
88.186
+3.233
3.81%
jan 1, 2004
89.688
+1.502
1.7%
jan 1, 2010
97.322
+7.634
8.51%
jan 1, 2012
101.962
+4.64
4.77%
jan 1, 2013
105.321
+3.359
3.29%
jan 1, 2014
99.416
-5.906
-5.61%
jan 1, 2015
108.813
+9.397
9.45%
Ranking of countries by current statistics by years


Comments: