29
/
en
AIzaSyAYiBZKx7MnpbEhh9jyipgxe19OcubqV5w
April 1, 2024
188401
Malaysia
MYS
true
2
1
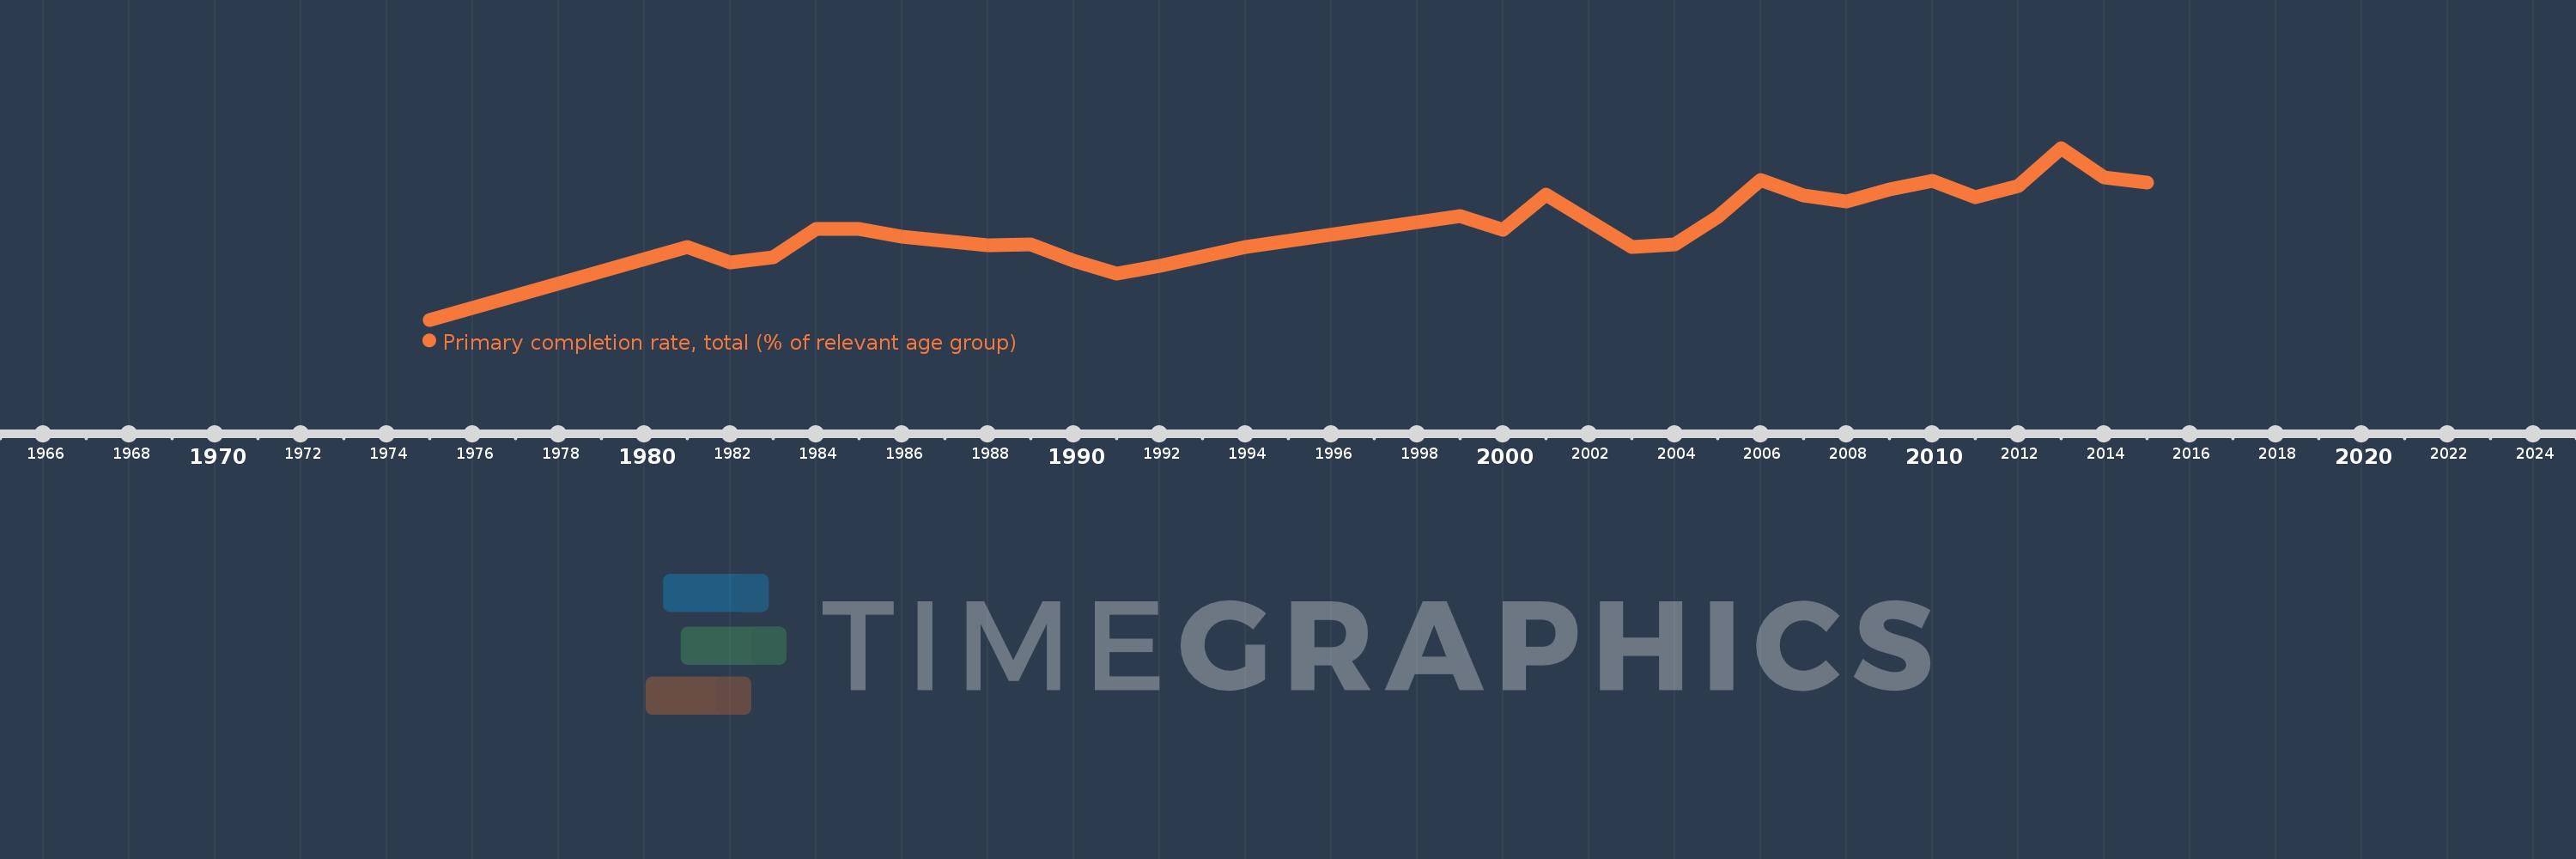
Primary completion rate, total (% of relevant age group)
2015,2014,2013,2012,2011,2010,2009,2008,2007,2006,2005,2004,2003,2001,2000,1999,1994,1992,1991,1990,1989,1988,1986,1985,1984,1983,1982,1981,1975
This statistics in other country:
AfghanistanAlbaniaAlgeriaAngolaAntigua and BarbudaArab WorldArgentinaArmeniaArubaAustriaAzerbaijanBahamas, TheBahrainBangladeshBarbadosBelarusBelgiumBelizeBeninBermudaBhutanBoliviaBosnia and HerzegovinaBotswanaBrazilBritish Virgin IslandsBrunei DarussalamBulgariaBurkina FasoBurundiCabo VerdeCambodiaCameroonCanadaCaribbean small statesCentral African RepublicCentral Europe and the BalticsChadChileChinaColombiaComorosCongo, Dem. Rep.Congo, Rep.Costa RicaCote d'IvoireCroatiaCubaCyprusCzech RepublicDenmarkDjiboutiDominicaDominican RepublicEarly-demographic dividendEast Asia & PacificEast Asia & Pacific (excluding high income)East Asia & Pacific (IDA & IBRD countries)EcuadorEgypt, Arab Rep.El SalvadorEquatorial GuineaEritreaEstoniaEthiopiaEuro areaEurope & Central AsiaEurope & Central Asia (excluding high income)Europe & Central Asia (IDA & IBRD countries)European UnionFijiFinlandFragile and conflict affected situationsFranceGabonGambia, TheGeorgiaGermanyGhanaGreeceGrenadaGuatemalaGuineaGuinea-BissauGuyanaHaitiHeavily indebted poor countries (HIPC)High incomeHondurasHong Kong SAR, ChinaHungaryIBRD onlyIcelandIDA & IBRD totalIDA blendIDA onlyIDA totalIndiaIndonesiaIran, Islamic Rep.IraqIrelandIsraelItalyJamaicaJapanJordanKazakhstanKenyaKiribatiKorea, Dem. People’s Rep.Korea, Rep.KuwaitKyrgyz RepublicLao PDRLate-demographic dividendLatin America & Caribbean Latin America & Caribbean (excluding high income)Latin America & the Caribbean (IDA & IBRD countries)LatviaLeast developed countries: UN classificationLebanonLesothoLiberiaLibyaLiechtensteinLithuaniaLow & middle incomeLow incomeLower middle incomeLuxembourgMacao SAR, ChinaMacedonia, FYRMadagascarMalawiMalaysiaMaldivesMaliMaltaMarshall IslandsMauritaniaMauritiusMexicoMiddle East & North AfricaMiddle East & North Africa (excluding high income)Middle East & North Africa (IDA & IBRD countries)Middle incomeMoldovaMongoliaMontenegroMoroccoMozambiqueMyanmarNamibiaNauruNepalNetherlandsNew ZealandNicaraguaNigerNigeriaNorwayOECD membersOmanOther small statesPacific island small statesPakistanPalauPanamaPapua New GuineaParaguayPeruPhilippinesPolandPortugalPost-demographic dividendPre-demographic dividendQatarRomaniaRussian FederationRwandaSamoaSan MarinoSao Tome and PrincipeSaudi ArabiaSenegalSerbiaSeychellesSierra LeoneSlovak RepublicSloveniaSmall statesSolomon IslandsSouth AfricaSouth AsiaSouth Asia (IDA & IBRD)South SudanSpainSri LankaSt. Kitts and NevisSt. LuciaSt. Vincent and the GrenadinesSub-Saharan Africa Sub-Saharan Africa (excluding high income)Sub-Saharan Africa (IDA & IBRD countries)SudanSurinameSwazilandSwedenSwitzerlandSyrian Arab RepublicTajikistanTanzaniaThailandTimor-LesteTogoTongaTrinidad and TobagoTunisiaTurkeyTuvaluUgandaUkraineUnited Arab EmiratesUpper middle incomeUruguayUzbekistanVanuatuVenezuela, RBVietnamWest Bank and GazaWorldYemen, Rep.ZambiaZimbabwe Timeline:
This timeline shows a graph from 1975 to 2015 of Malaysia. No data until 1974. Number of actual observations by date: 29.
Source name:
World Development Indicators
Source organization:
United Nations Educational, Scientific, and Cultural Organization (UNESCO) Institute for Statistics.
Categories, topics:
Aid Effectiveness, Climate Change, Education
Last updated:
apr 23, 2017
Indicators value changes by year
Minimum:
80.552
jan 1, 1975
Maximum:
108.002
jan 1, 2013
At the date of observation
Value
Absolute change
Change from previous value
jan 1, 1975
80.552
+80.552
0.0%
jan 1, 1981
92.224
+11.672
14.49%
jan 1, 1982
89.761
-2.462
-2.67%
jan 1, 1983
90.482
+0.721
0.8%
jan 1, 1984
94.992
+4.51
4.98%
jan 1, 1985
95.016
+0.024
0.03%
jan 1, 1986
93.888
-1.128
-1.19%
jan 1, 1988
92.49
-1.398
-1.49%
jan 1, 1989
92.544
+0.055
0.06%
jan 1, 1990
89.945
-2.6
-2.81%
jan 1, 1991
87.863
-2.081
-2.31%
jan 1, 1992
89.163
+1.299
1.48%
jan 1, 1994
92.14
+2.978
3.34%
jan 1, 1999
97.104
+4.964
5.39%
jan 1, 2000
94.983
-2.121
-2.18%
jan 1, 2001
100.568
+5.584
5.88%
jan 1, 2003
92.22
-8.347
-8.3%
jan 1, 2004
92.54
+0.319
0.35%
jan 1, 2005
96.913
+4.373
4.73%
jan 1, 2006
102.94
+6.027
6.22%
jan 1, 2007
100.425
-2.515
-2.44%
jan 1, 2008
99.41
-1.015
-1.01%
jan 1, 2009
101.381
+1.971
1.98%
jan 1, 2010
102.69
+1.31
1.29%
jan 1, 2011
100.084
-2.606
-2.54%
jan 1, 2012
101.886
+1.802
1.8%
jan 1, 2013
108.002
+6.116
6.0%
jan 1, 2014
103.353
-4.649
-4.3%
jan 1, 2015
102.417
-0.937
-0.91%
Ranking of countries by current statistics by years


Comments: