29
/
en
AIzaSyAYiBZKx7MnpbEhh9jyipgxe19OcubqV5w
April 1, 2024
125434
Egypt, Arab Rep.
EGY
true
2
1
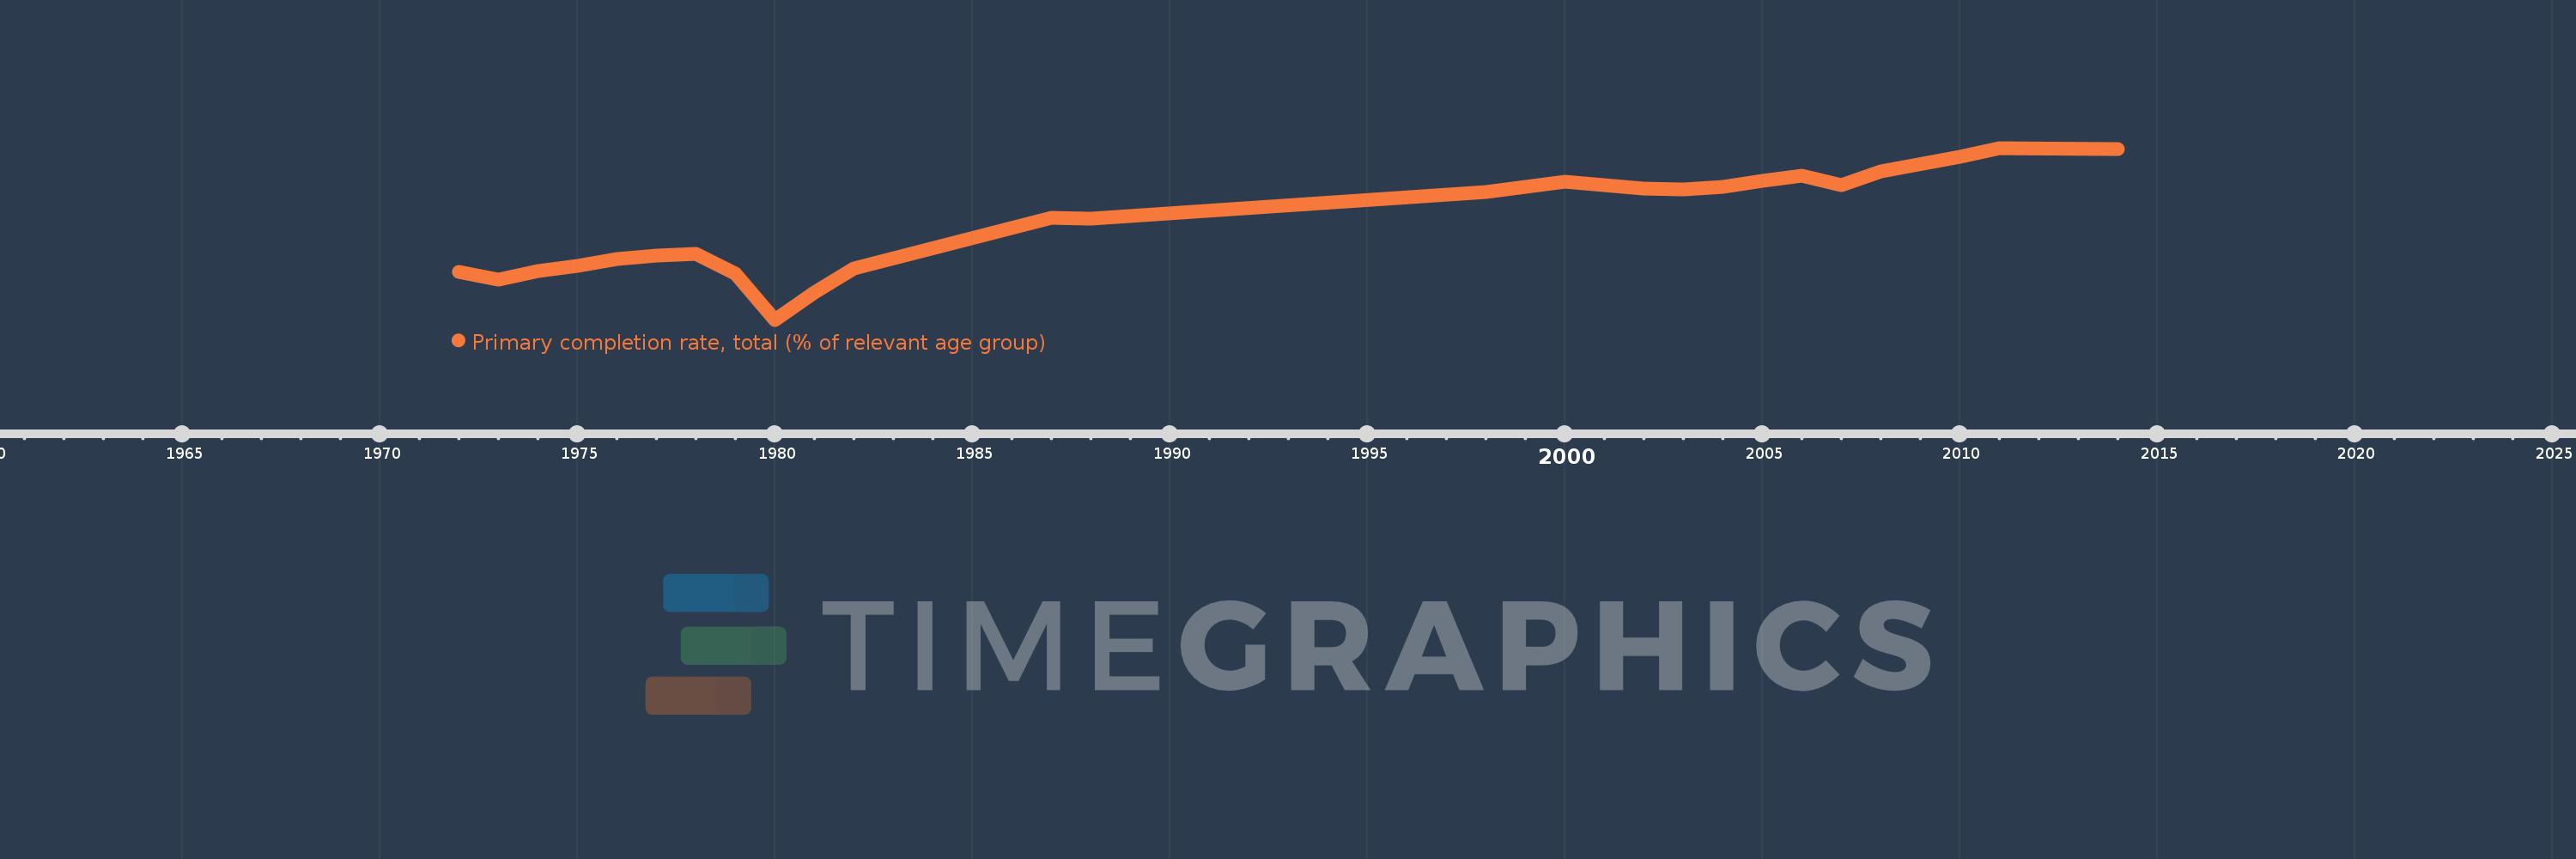
Primary completion rate, total (% of relevant age group)
2014,2011,2010,2008,2007,2006,2005,2004,2003,2002,2001,2000,1998,1988,1987,1982,1981,1980,1979,1978,1977,1976,1975,1974,1973,1972
This statistics in other country:
AfghanistanAlbaniaAlgeriaAngolaAntigua and BarbudaArab WorldArgentinaArmeniaArubaAustriaAzerbaijanBahamas, TheBahrainBangladeshBarbadosBelarusBelgiumBelizeBeninBermudaBhutanBoliviaBosnia and HerzegovinaBotswanaBrazilBritish Virgin IslandsBrunei DarussalamBulgariaBurkina FasoBurundiCabo VerdeCambodiaCameroonCanadaCaribbean small statesCentral African RepublicCentral Europe and the BalticsChadChileChinaColombiaComorosCongo, Dem. Rep.Congo, Rep.Costa RicaCote d'IvoireCroatiaCubaCyprusCzech RepublicDenmarkDjiboutiDominicaDominican RepublicEarly-demographic dividendEast Asia & PacificEast Asia & Pacific (excluding high income)East Asia & Pacific (IDA & IBRD countries)EcuadorEgypt, Arab Rep.El SalvadorEquatorial GuineaEritreaEstoniaEthiopiaEuro areaEurope & Central AsiaEurope & Central Asia (excluding high income)Europe & Central Asia (IDA & IBRD countries)European UnionFijiFinlandFragile and conflict affected situationsFranceGabonGambia, TheGeorgiaGermanyGhanaGreeceGrenadaGuatemalaGuineaGuinea-BissauGuyanaHaitiHeavily indebted poor countries (HIPC)High incomeHondurasHong Kong SAR, ChinaHungaryIBRD onlyIcelandIDA & IBRD totalIDA blendIDA onlyIDA totalIndiaIndonesiaIran, Islamic Rep.IraqIrelandIsraelItalyJamaicaJapanJordanKazakhstanKenyaKiribatiKorea, Dem. People’s Rep.Korea, Rep.KuwaitKyrgyz RepublicLao PDRLate-demographic dividendLatin America & Caribbean Latin America & Caribbean (excluding high income)Latin America & the Caribbean (IDA & IBRD countries)LatviaLeast developed countries: UN classificationLebanonLesothoLiberiaLibyaLiechtensteinLithuaniaLow & middle incomeLow incomeLower middle incomeLuxembourgMacao SAR, ChinaMacedonia, FYRMadagascarMalawiMalaysiaMaldivesMaliMaltaMarshall IslandsMauritaniaMauritiusMexicoMiddle East & North AfricaMiddle East & North Africa (excluding high income)Middle East & North Africa (IDA & IBRD countries)Middle incomeMoldovaMongoliaMontenegroMoroccoMozambiqueMyanmarNamibiaNauruNepalNetherlandsNew ZealandNicaraguaNigerNigeriaNorwayOECD membersOmanOther small statesPacific island small statesPakistanPalauPanamaPapua New GuineaParaguayPeruPhilippinesPolandPortugalPost-demographic dividendPre-demographic dividendQatarRomaniaRussian FederationRwandaSamoaSan MarinoSao Tome and PrincipeSaudi ArabiaSenegalSerbiaSeychellesSierra LeoneSlovak RepublicSloveniaSmall statesSolomon IslandsSouth AfricaSouth AsiaSouth Asia (IDA & IBRD)South SudanSpainSri LankaSt. Kitts and NevisSt. LuciaSt. Vincent and the GrenadinesSub-Saharan Africa Sub-Saharan Africa (excluding high income)Sub-Saharan Africa (IDA & IBRD countries)SudanSurinameSwazilandSwedenSwitzerlandSyrian Arab RepublicTajikistanTanzaniaThailandTimor-LesteTogoTongaTrinidad and TobagoTunisiaTurkeyTuvaluUgandaUkraineUnited Arab EmiratesUpper middle incomeUruguayUzbekistanVanuatuVenezuela, RBVietnamWest Bank and GazaWorldYemen, Rep.ZambiaZimbabwe Timeline:
This timeline shows a graph from 1972 to 2014 of Egypt, Arab Rep.. No data until 1971. Number of actual observations by date: 26.
Source name:
World Development Indicators
Source organization:
United Nations Educational, Scientific, and Cultural Organization (UNESCO) Institute for Statistics.
Categories, topics:
Aid Effectiveness, Climate Change, Education
Last updated:
apr 23, 2017
Indicators value changes by year
Minimum:
36.935
jan 1, 1980
Maximum:
104.248
jan 1, 2011
At the date of observation
Value
Absolute change
Change from previous value
jan 1, 1972
55.847
+55.847
0.0%
jan 1, 1973
52.605
-3.242
-5.8%
jan 1, 1974
55.991
+3.385
6.44%
jan 1, 1975
57.981
+1.99
3.55%
jan 1, 1976
60.758
+2.777
4.79%
jan 1, 1977
62.103
+1.345
2.21%
jan 1, 1978
62.677
+0.574
0.93%
jan 1, 1979
55.1
-7.578
-12.09%
jan 1, 1980
36.935
-18.165
-32.97%
jan 1, 1981
47.671
+10.736
29.07%
jan 1, 1982
57.087
+9.416
19.75%
jan 1, 1987
76.767
+19.681
34.48%
jan 1, 1988
76.684
-0.084
-0.11%
jan 1, 1998
87.109
+10.426
13.6%
jan 1, 2000
90.937
+3.828
4.39%
jan 1, 2001
89.515
-1.422
-1.56%
jan 1, 2002
88.393
-1.122
-1.25%
jan 1, 2003
87.884
-0.509
-0.58%
jan 1, 2004
89.029
+1.144
1.3%
jan 1, 2005
91.47
+2.441
2.74%
jan 1, 2006
93.247
+1.778
1.94%
jan 1, 2007
89.803
-3.444
-3.69%
jan 1, 2008
95.163
+5.36
5.97%
jan 1, 2010
100.73
+5.567
5.85%
jan 1, 2011
104.248
+3.519
3.49%
jan 1, 2014
103.824
-0.425
-0.41%
Ranking of countries by current statistics by years


Comments: