29
/
en
AIzaSyAYiBZKx7MnpbEhh9jyipgxe19OcubqV5w
April 1, 2024
164177
Japan
JPN
true
2
1
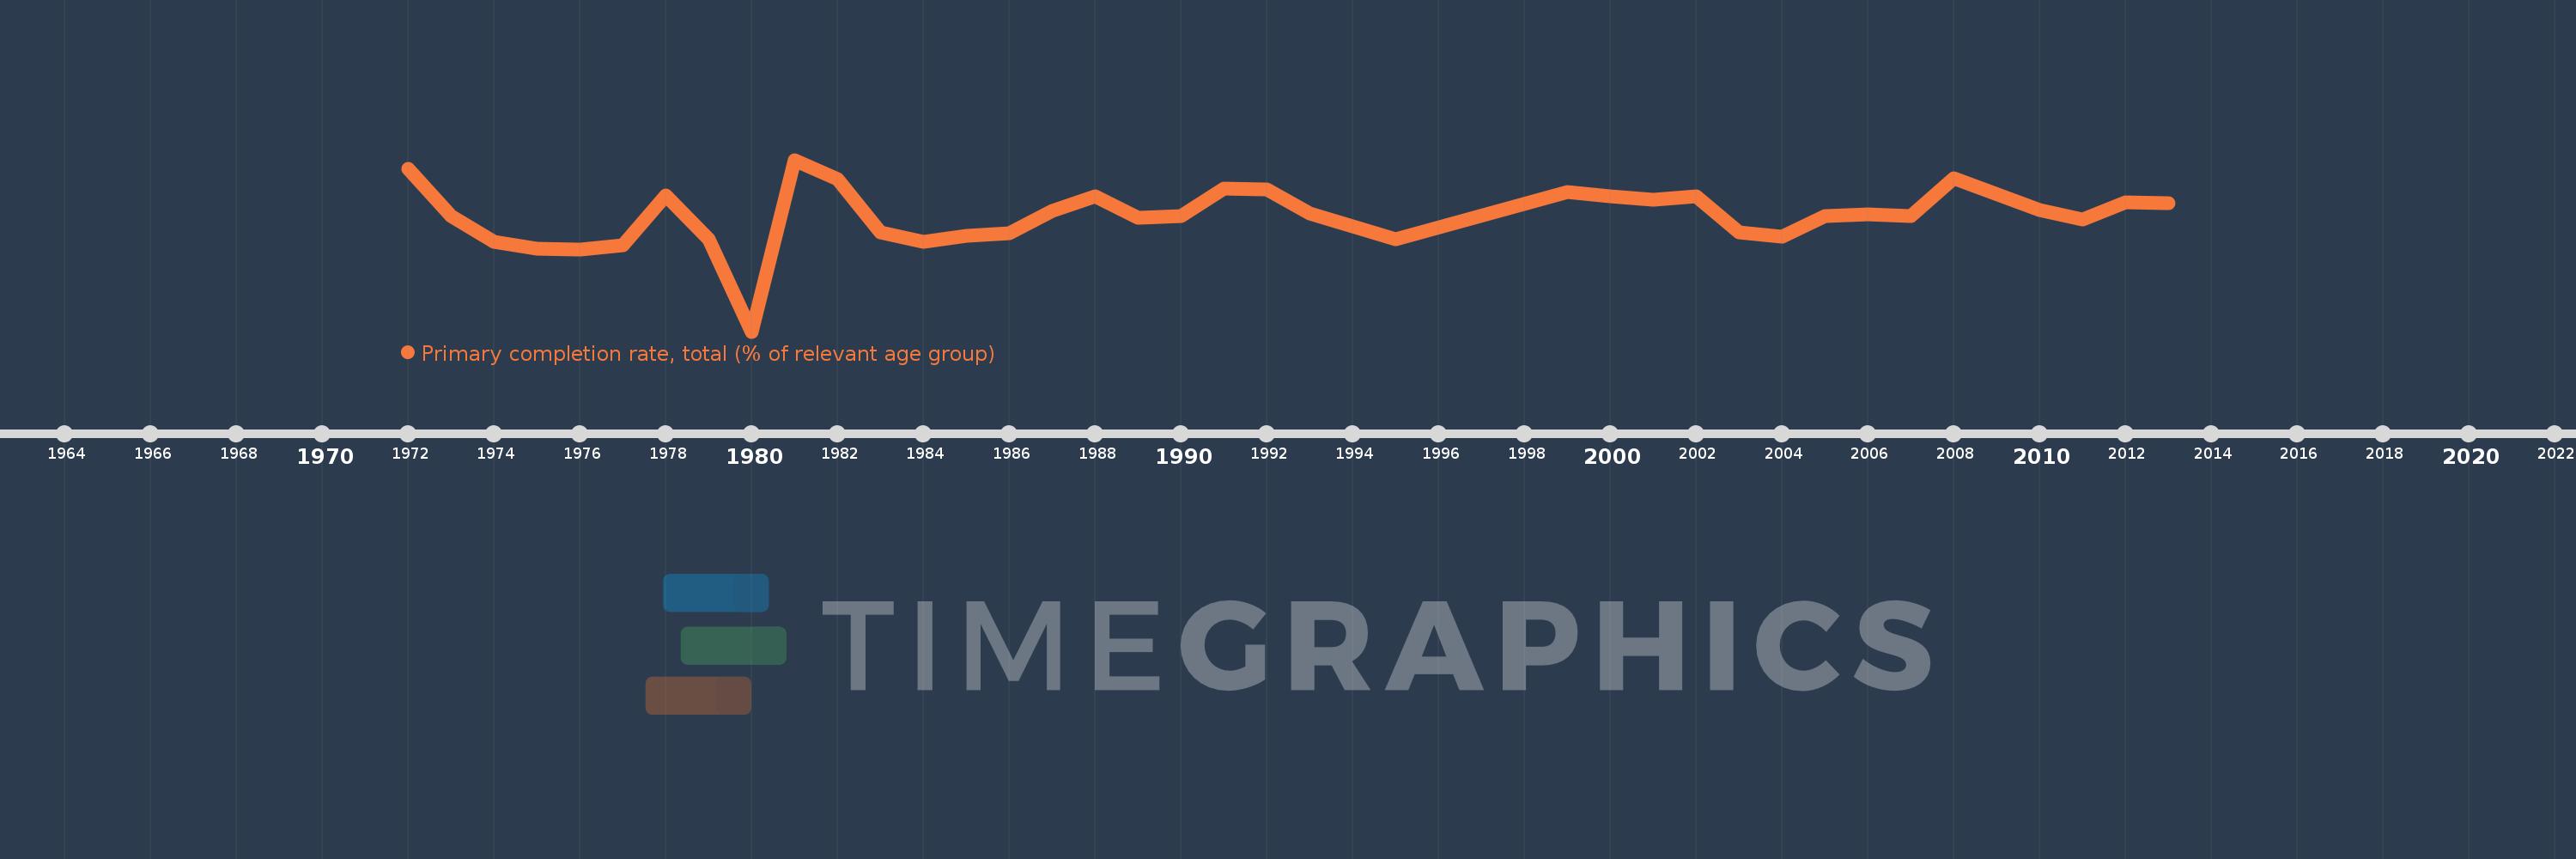
Primary completion rate, total (% of relevant age group)
2013,2012,2011,2010,2008,2007,2006,2005,2004,2003,2002,2001,2000,1999,1995,1993,1992,1991,1990,1989,1988,1987,1986,1985,1984,1983,1982,1981,1980,1979,1978,1977,1976,1975,1974,1973,1972
This statistics in other country:
AfghanistanAlbaniaAlgeriaAngolaAntigua and BarbudaArab WorldArgentinaArmeniaArubaAustriaAzerbaijanBahamas, TheBahrainBangladeshBarbadosBelarusBelgiumBelizeBeninBermudaBhutanBoliviaBosnia and HerzegovinaBotswanaBrazilBritish Virgin IslandsBrunei DarussalamBulgariaBurkina FasoBurundiCabo VerdeCambodiaCameroonCanadaCaribbean small statesCentral African RepublicCentral Europe and the BalticsChadChileChinaColombiaComorosCongo, Dem. Rep.Congo, Rep.Costa RicaCote d'IvoireCroatiaCubaCyprusCzech RepublicDenmarkDjiboutiDominicaDominican RepublicEarly-demographic dividendEast Asia & PacificEast Asia & Pacific (excluding high income)East Asia & Pacific (IDA & IBRD countries)EcuadorEgypt, Arab Rep.El SalvadorEquatorial GuineaEritreaEstoniaEthiopiaEuro areaEurope & Central AsiaEurope & Central Asia (excluding high income)Europe & Central Asia (IDA & IBRD countries)European UnionFijiFinlandFragile and conflict affected situationsFranceGabonGambia, TheGeorgiaGermanyGhanaGreeceGrenadaGuatemalaGuineaGuinea-BissauGuyanaHaitiHeavily indebted poor countries (HIPC)High incomeHondurasHong Kong SAR, ChinaHungaryIBRD onlyIcelandIDA & IBRD totalIDA blendIDA onlyIDA totalIndiaIndonesiaIran, Islamic Rep.IraqIrelandIsraelItalyJamaicaJapanJordanKazakhstanKenyaKiribatiKorea, Dem. People’s Rep.Korea, Rep.KuwaitKyrgyz RepublicLao PDRLate-demographic dividendLatin America & Caribbean Latin America & Caribbean (excluding high income)Latin America & the Caribbean (IDA & IBRD countries)LatviaLeast developed countries: UN classificationLebanonLesothoLiberiaLibyaLiechtensteinLithuaniaLow & middle incomeLow incomeLower middle incomeLuxembourgMacao SAR, ChinaMacedonia, FYRMadagascarMalawiMalaysiaMaldivesMaliMaltaMarshall IslandsMauritaniaMauritiusMexicoMiddle East & North AfricaMiddle East & North Africa (excluding high income)Middle East & North Africa (IDA & IBRD countries)Middle incomeMoldovaMongoliaMontenegroMoroccoMozambiqueMyanmarNamibiaNauruNepalNetherlandsNew ZealandNicaraguaNigerNigeriaNorwayOECD membersOmanOther small statesPacific island small statesPakistanPalauPanamaPapua New GuineaParaguayPeruPhilippinesPolandPortugalPost-demographic dividendPre-demographic dividendQatarRomaniaRussian FederationRwandaSamoaSan MarinoSao Tome and PrincipeSaudi ArabiaSenegalSerbiaSeychellesSierra LeoneSlovak RepublicSloveniaSmall statesSolomon IslandsSouth AfricaSouth AsiaSouth Asia (IDA & IBRD)South SudanSpainSri LankaSt. Kitts and NevisSt. LuciaSt. Vincent and the GrenadinesSub-Saharan Africa Sub-Saharan Africa (excluding high income)Sub-Saharan Africa (IDA & IBRD countries)SudanSurinameSwazilandSwedenSwitzerlandSyrian Arab RepublicTajikistanTanzaniaThailandTimor-LesteTogoTongaTrinidad and TobagoTunisiaTurkeyTuvaluUgandaUkraineUnited Arab EmiratesUpper middle incomeUruguayUzbekistanVanuatuVenezuela, RBVietnamWest Bank and GazaWorldYemen, Rep.ZambiaZimbabwe Timeline:
This timeline shows a graph from 1972 to 2013 of Japan. No data until 1971. Number of actual observations by date: 37.
Source name:
World Development Indicators
Source organization:
United Nations Educational, Scientific, and Cultural Organization (UNESCO) Institute for Statistics.
Categories, topics:
Aid Effectiveness, Climate Change, Education
Last updated:
apr 23, 2017
Indicators value changes by year
Minimum:
90.644
jan 1, 1980
Maximum:
105.931
jan 1, 1981
At the date of observation
Value
Absolute change
Change from previous value
jan 1, 1972
105.133
+105.133
0.0%
jan 1, 1973
100.911
-4.223
-4.02%
jan 1, 1974
98.642
-2.268
-2.25%
jan 1, 1975
98.009
-0.633
-0.64%
jan 1, 1976
97.924
-0.085
-0.09%
jan 1, 1977
98.35
+0.425
0.43%
jan 1, 1978
102.792
+4.443
4.52%
jan 1, 1979
98.839
-3.953
-3.85%
jan 1, 1980
90.644
-8.195
-8.29%
jan 1, 1981
105.931
+15.287
16.86%
jan 1, 1982
104.204
-1.727
-1.63%
jan 1, 1983
99.435
-4.769
-4.58%
jan 1, 1984
98.648
-0.787
-0.79%
jan 1, 1985
99.131
+0.483
0.49%
jan 1, 1986
99.409
+0.277
0.28%
jan 1, 1987
101.384
+1.975
1.99%
jan 1, 1988
102.657
+1.273
1.26%
jan 1, 1989
100.76
-1.897
-1.85%
jan 1, 1990
100.889
+0.129
0.13%
jan 1, 1991
103.397
+2.508
2.49%
jan 1, 1992
103.322
-0.075
-0.07%
jan 1, 1993
101.159
-2.163
-2.09%
jan 1, 1995
98.893
-2.266
-2.24%
jan 1, 1999
103.067
+4.173
4.22%
jan 1, 2000
102.688
-0.378
-0.37%
jan 1, 2001
102.38
-0.308
-0.3%
jan 1, 2002
102.656
+0.276
0.27%
jan 1, 2003
99.443
-3.213
-3.13%
jan 1, 2004
99.055
-0.389
-0.39%
jan 1, 2005
100.945
+1.891
1.91%
jan 1, 2006
101.101
+0.155
0.15%
jan 1, 2007
100.911
-0.19
-0.19%
jan 1, 2008
104.324
+3.414
3.38%
jan 1, 2010
101.427
-2.897
-2.78%
jan 1, 2011
100.594
-0.833
-0.82%
jan 1, 2012
102.116
+1.522
1.51%
jan 1, 2013
102.056
-0.06
-0.06%
Ranking of countries by current statistics by years


Comments: