29
/
en
AIzaSyAYiBZKx7MnpbEhh9jyipgxe19OcubqV5w
April 1, 2024
258889
Syrian Arab Republic
SYR
true
2
1
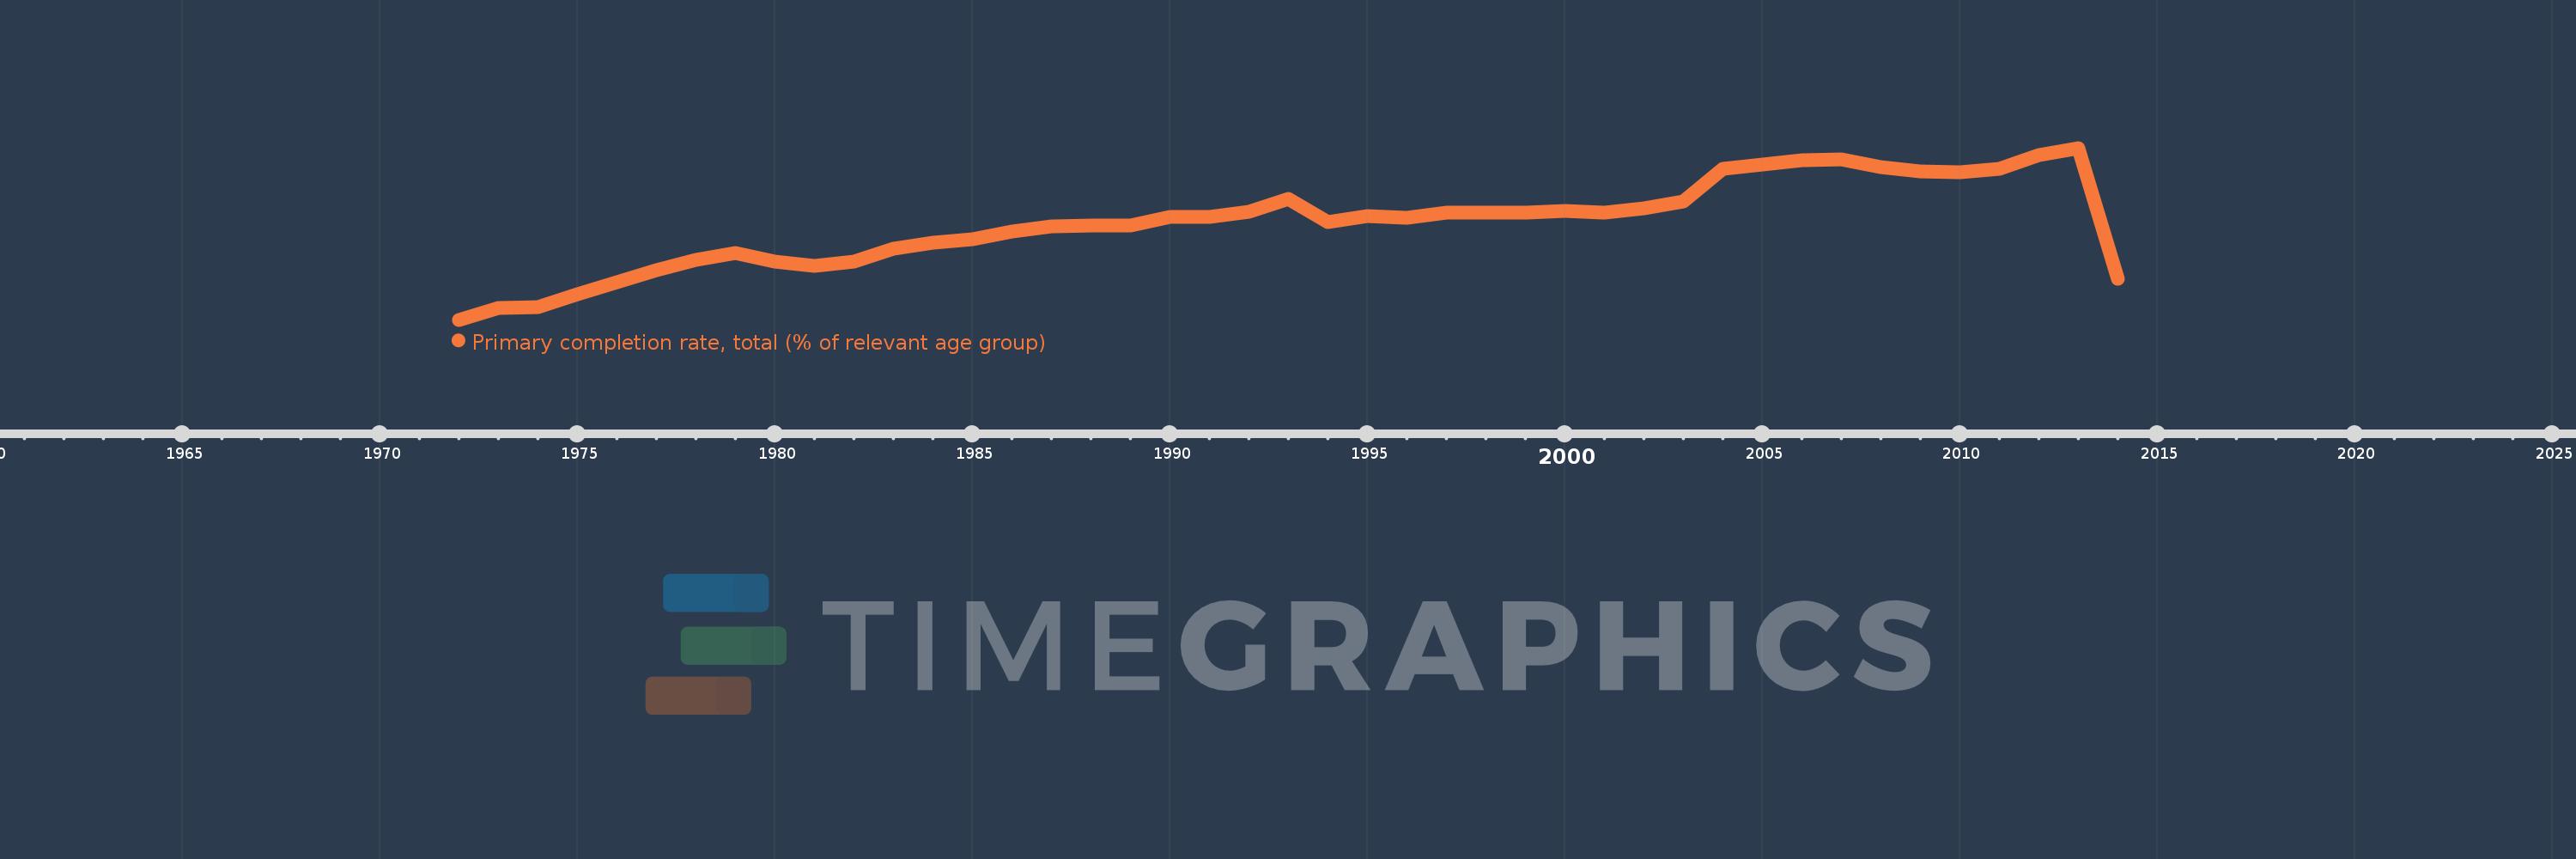
Primary completion rate, total (% of relevant age group)
2014,2013,2012,2011,2010,2009,2008,2007,2006,2005,2004,2003,2002,2001,2000,1999,1998,1997,1996,1995,1994,1993,1992,1991,1990,1989,1988,1987,1986,1985,1984,1983,1982,1981,1980,1979,1978,1977,1976,1975,1974,1973,1972
This statistics in other country:
AfghanistanAlbaniaAlgeriaAngolaAntigua and BarbudaArab WorldArgentinaArmeniaArubaAustriaAzerbaijanBahamas, TheBahrainBangladeshBarbadosBelarusBelgiumBelizeBeninBermudaBhutanBoliviaBosnia and HerzegovinaBotswanaBrazilBritish Virgin IslandsBrunei DarussalamBulgariaBurkina FasoBurundiCabo VerdeCambodiaCameroonCanadaCaribbean small statesCentral African RepublicCentral Europe and the BalticsChadChileChinaColombiaComorosCongo, Dem. Rep.Congo, Rep.Costa RicaCote d'IvoireCroatiaCubaCyprusCzech RepublicDenmarkDjiboutiDominicaDominican RepublicEarly-demographic dividendEast Asia & PacificEast Asia & Pacific (excluding high income)East Asia & Pacific (IDA & IBRD countries)EcuadorEgypt, Arab Rep.El SalvadorEquatorial GuineaEritreaEstoniaEthiopiaEuro areaEurope & Central AsiaEurope & Central Asia (excluding high income)Europe & Central Asia (IDA & IBRD countries)European UnionFijiFinlandFragile and conflict affected situationsFranceGabonGambia, TheGeorgiaGermanyGhanaGreeceGrenadaGuatemalaGuineaGuinea-BissauGuyanaHaitiHeavily indebted poor countries (HIPC)High incomeHondurasHong Kong SAR, ChinaHungaryIBRD onlyIcelandIDA & IBRD totalIDA blendIDA onlyIDA totalIndiaIndonesiaIran, Islamic Rep.IraqIrelandIsraelItalyJamaicaJapanJordanKazakhstanKenyaKiribatiKorea, Dem. People’s Rep.Korea, Rep.KuwaitKyrgyz RepublicLao PDRLate-demographic dividendLatin America & Caribbean Latin America & Caribbean (excluding high income)Latin America & the Caribbean (IDA & IBRD countries)LatviaLeast developed countries: UN classificationLebanonLesothoLiberiaLibyaLiechtensteinLithuaniaLow & middle incomeLow incomeLower middle incomeLuxembourgMacao SAR, ChinaMacedonia, FYRMadagascarMalawiMalaysiaMaldivesMaliMaltaMarshall IslandsMauritaniaMauritiusMexicoMiddle East & North AfricaMiddle East & North Africa (excluding high income)Middle East & North Africa (IDA & IBRD countries)Middle incomeMoldovaMongoliaMontenegroMoroccoMozambiqueMyanmarNamibiaNauruNepalNetherlandsNew ZealandNicaraguaNigerNigeriaNorwayOECD membersOmanOther small statesPacific island small statesPakistanPalauPanamaPapua New GuineaParaguayPeruPhilippinesPolandPortugalPost-demographic dividendPre-demographic dividendQatarRomaniaRussian FederationRwandaSamoaSan MarinoSao Tome and PrincipeSaudi ArabiaSenegalSerbiaSeychellesSierra LeoneSlovak RepublicSloveniaSmall statesSolomon IslandsSouth AfricaSouth AsiaSouth Asia (IDA & IBRD)South SudanSpainSri LankaSt. Kitts and NevisSt. LuciaSt. Vincent and the GrenadinesSub-Saharan Africa Sub-Saharan Africa (excluding high income)Sub-Saharan Africa (IDA & IBRD countries)SudanSurinameSwazilandSwedenSwitzerlandSyrian Arab RepublicTajikistanTanzaniaThailandTimor-LesteTogoTongaTrinidad and TobagoTunisiaTurkeyTuvaluUgandaUkraineUnited Arab EmiratesUpper middle incomeUruguayUzbekistanVanuatuVenezuela, RBVietnamWest Bank and GazaWorldYemen, Rep.ZambiaZimbabwe Timeline:
This timeline shows a graph from 1972 to 2014 of Syrian Arab Republic. No data until 1971. Number of actual observations by date: 43.
Source name:
World Development Indicators
Source organization:
United Nations Educational, Scientific, and Cultural Organization (UNESCO) Institute for Statistics.
Categories, topics:
Aid Effectiveness, Climate Change, Education
Last updated:
apr 23, 2017
Indicators value changes by year
Minimum:
55.138
jan 1, 1972
Maximum:
113.462
jan 1, 2013
At the date of observation
Value
Absolute change
Change from previous value
jan 1, 1972
55.138
+55.138
0.0%
jan 1, 1973
59.035
+3.897
7.07%
jan 1, 1974
59.3
+0.265
0.45%
jan 1, 1975
63.77
+4.47
7.54%
jan 1, 1976
67.856
+4.085
6.41%
jan 1, 1977
72.006
+4.15
6.12%
jan 1, 1978
75.479
+3.474
4.82%
jan 1, 1979
77.835
+2.356
3.12%
jan 1, 1980
74.901
-2.934
-3.77%
jan 1, 1981
73.309
-1.592
-2.13%
jan 1, 1982
74.74
+1.431
1.95%
jan 1, 1983
79.192
+4.452
5.96%
jan 1, 1984
81.19
+1.998
2.52%
jan 1, 1985
82.488
+1.299
1.6%
jan 1, 1986
85.065
+2.577
3.12%
jan 1, 1987
86.809
+1.744
2.05%
jan 1, 1988
87.181
+0.373
0.43%
jan 1, 1989
87.09
-0.092
-0.11%
jan 1, 1990
89.906
+2.816
3.23%
jan 1, 1991
90.112
+0.206
0.23%
jan 1, 1992
91.681
+1.569
1.74%
jan 1, 1993
96.081
+4.4
4.8%
jan 1, 1994
88.244
-7.838
-8.16%
jan 1, 1995
90.42
+2.176
2.47%
jan 1, 1996
89.845
-0.575
-0.64%
jan 1, 1997
91.615
+1.77
1.97%
jan 1, 1998
91.555
-0.06
-0.07%
jan 1, 1999
91.495
-0.06
-0.07%
jan 1, 2000
92.096
+0.601
0.66%
jan 1, 2001
91.588
-0.509
-0.55%
jan 1, 2002
93.063
+1.475
1.61%
jan 1, 2003
95.302
+2.24
2.41%
jan 1, 2004
106.437
+11.135
11.68%
jan 1, 2005
107.859
+1.422
1.34%
jan 1, 2006
109.435
+1.576
1.46%
jan 1, 2007
109.505
+0.07
0.06%
jan 1, 2008
107.039
-2.466
-2.25%
jan 1, 2009
105.634
-1.404
-1.31%
jan 1, 2010
105.21
-0.424
-0.4%
jan 1, 2011
106.327
+1.117
1.06%
jan 1, 2012
110.951
+4.624
4.35%
jan 1, 2013
113.462
+2.511
2.26%
jan 1, 2014
68.921
-44.54
-39.26%
Ranking of countries by current statistics by years


Comments: