29
/
en
AIzaSyAYiBZKx7MnpbEhh9jyipgxe19OcubqV5w
April 1, 2024
94698
Burkina Faso
BFA
true
2
1
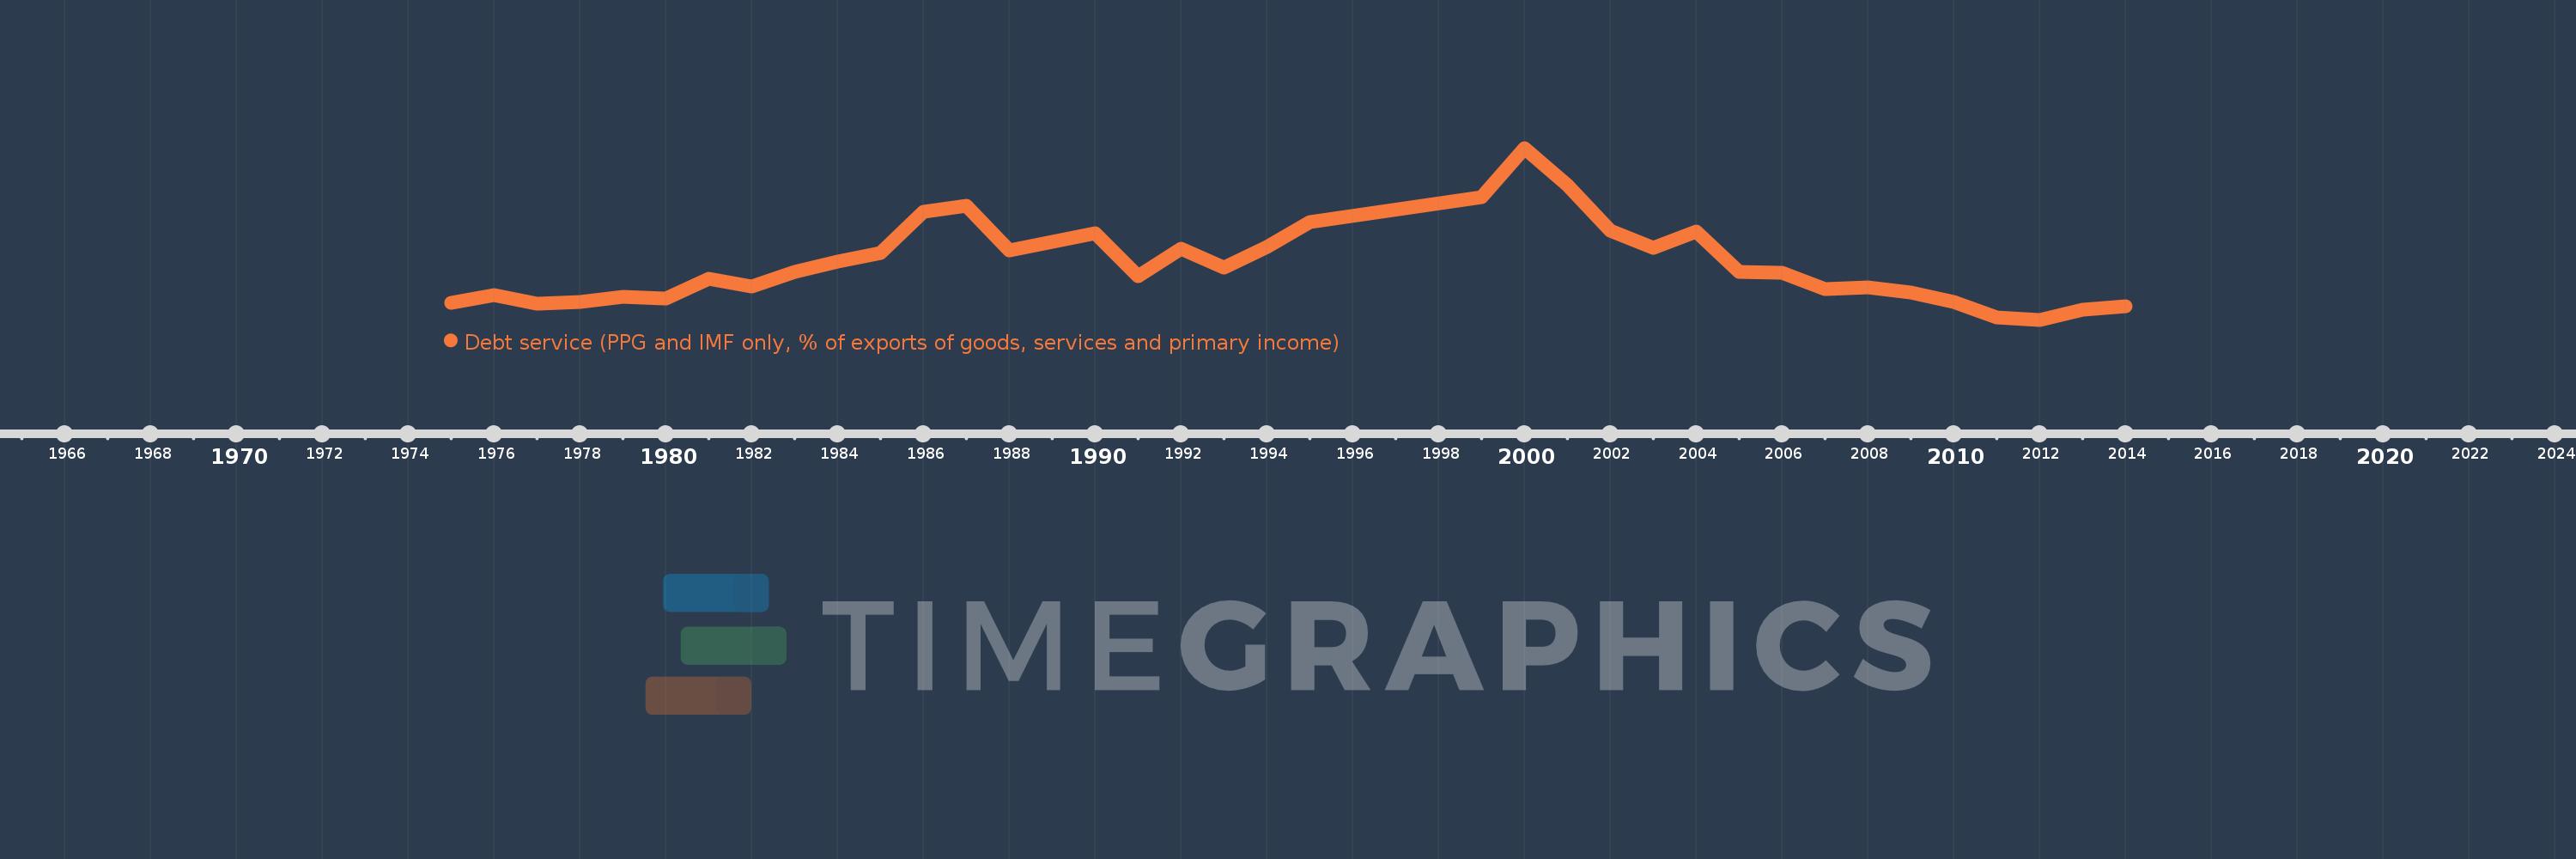
Debt service (PPG and IMF only, % of exports of goods, services and primary income)
2014,2013,2012,2011,2010,2009,2008,2007,2006,2005,2004,2003,2002,2001,2000,1999,1995,1994,1993,1992,1991,1990,1989,1988,1987,1986,1985,1984,1983,1982,1981,1980,1979,1978,1977,1976,1975
This statistics in other country:
Timeline:
This timeline shows a graph from 1975 to 2014 of Burkina Faso. No data until 1974. Number of actual observations by date: 37.
Source name:
World Development Indicators
Source organization:
World Bank, International Debt Statistics.
Categories, topics:
External Debt
Last updated:
apr 23, 2017
Indicators value changes by year
At the date of observation
Value
Absolute change
Change from previous value
jan 1, 1975
4.479
+4.479
0.0%
jan 1, 1976
5.501
+1.022
22.81%
jan 1, 1977
4.393
-1.108
-20.14%
jan 1, 1978
4.619
+0.226
5.15%
jan 1, 1979
5.257
+0.638
13.82%
jan 1, 1980
5.074
-0.183
-3.49%
jan 1, 1981
7.528
+2.454
48.36%
jan 1, 1982
6.57
-0.958
-12.72%
jan 1, 1983
8.313
+1.743
26.53%
jan 1, 1984
9.674
+1.361
16.37%
jan 1, 1985
10.76
+1.086
11.22%
jan 1, 1986
15.863
+5.103
47.42%
jan 1, 1987
16.628
+0.765
4.82%
jan 1, 1988
11.073
-5.555
-33.41%
jan 1, 1989
12.117
+1.044
9.43%
jan 1, 1990
13.142
+1.024
8.45%
jan 1, 1991
7.803
-5.339
-40.62%
jan 1, 1992
11.221
+3.418
43.8%
jan 1, 1993
8.887
-2.334
-20.8%
jan 1, 1994
11.468
+2.581
29.04%
jan 1, 1995
14.623
+3.155
27.51%
jan 1, 1999
17.69
+3.067
20.97%
jan 1, 2000
23.86
+6.17
34.88%
jan 1, 2001
19.181
-4.679
-19.61%
jan 1, 2002
13.508
-5.673
-29.58%
jan 1, 2003
11.397
-2.111
-15.62%
jan 1, 2004
13.375
+1.977
17.35%
jan 1, 2005
8.331
-5.043
-37.71%
jan 1, 2006
8.293
-0.038
-0.46%
jan 1, 2007
6.21
-2.083
-25.11%
jan 1, 2008
6.394
+0.183
2.95%
jan 1, 2009
5.806
-0.588
-9.2%
jan 1, 2010
4.624
-1.182
-20.36%
jan 1, 2011
2.665
-1.958
-42.36%
jan 1, 2012
2.374
-0.291
-10.93%
jan 1, 2013
3.661
+1.287
54.2%
jan 1, 2014
4.08
+0.42
11.46%
Ranking of countries by current statistics by years


Comments: