29
/
en
AIzaSyAYiBZKx7MnpbEhh9jyipgxe19OcubqV5w
April 1, 2024
154437
India
IND
true
2
1
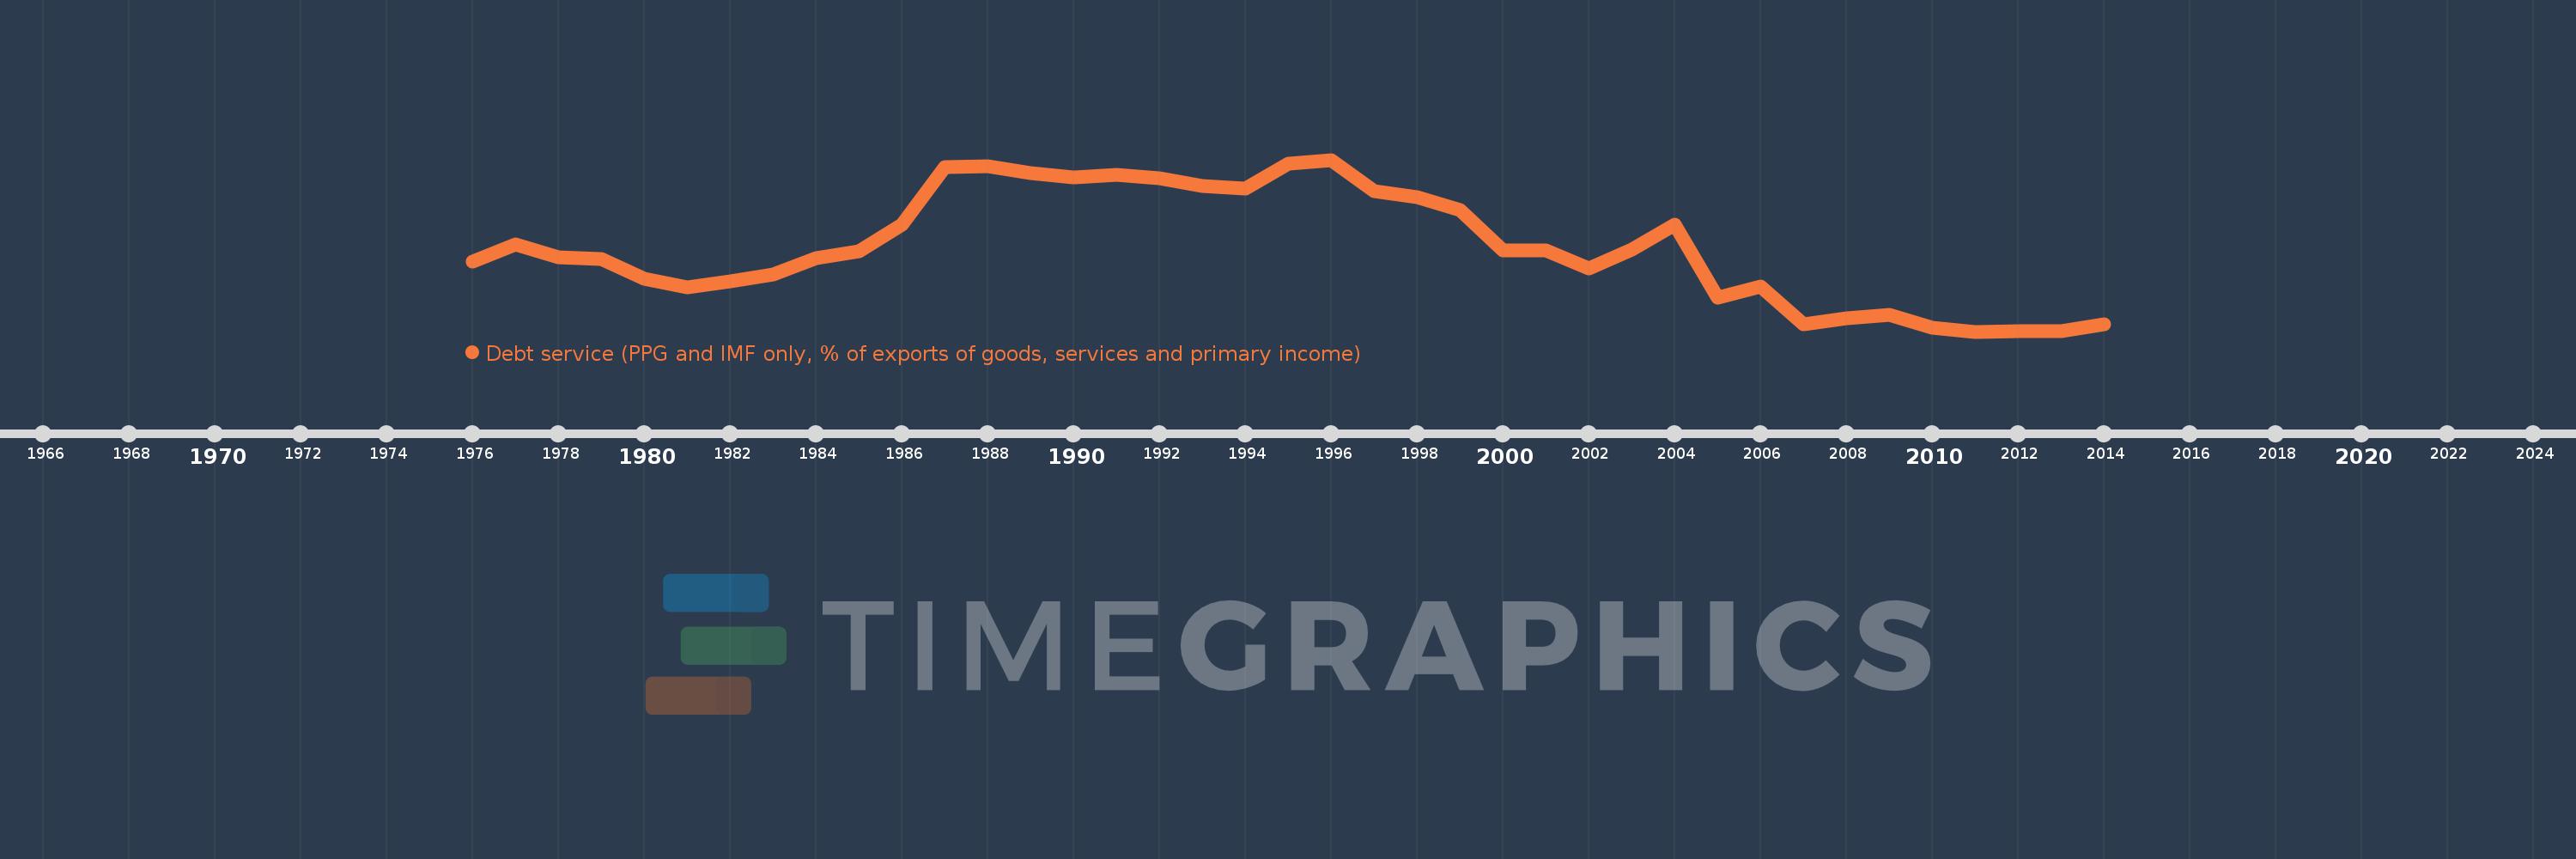
Debt service (PPG and IMF only, % of exports of goods, services and primary income)
2014,2013,2012,2011,2010,2009,2008,2007,2006,2005,2004,2003,2002,2001,2000,1999,1998,1997,1996,1995,1994,1993,1992,1991,1990,1989,1988,1987,1986,1985,1984,1983,1982,1981,1980,1979,1978,1977,1976
This statistics in other country:
Timeline:
This timeline shows a graph from 1976 to 2014 of India. No data until 1975. Number of actual observations by date: 39.
Source name:
World Development Indicators
Source organization:
World Bank, International Debt Statistics.
Categories, topics:
External Debt
Last updated:
apr 23, 2017
Indicators value changes by year
Maximum:
31.734
jan 1, 1996
At the date of observation
Value
Absolute change
Change from previous value
jan 1, 1976
13.901
+13.901
0.0%
jan 1, 1977
16.9
+2.998
21.57%
jan 1, 1978
14.648
-2.252
-13.33%
jan 1, 1979
14.378
-0.27
-1.84%
jan 1, 1980
10.902
-3.476
-24.17%
jan 1, 1981
9.54
-1.362
-12.49%
jan 1, 1982
10.524
+0.983
10.31%
jan 1, 1983
11.667
+1.143
10.86%
jan 1, 1984
14.605
+2.938
25.19%
jan 1, 1985
15.724
+1.119
7.66%
jan 1, 1986
20.483
+4.759
30.27%
jan 1, 1987
30.459
+9.976
48.7%
jan 1, 1988
30.675
+0.216
0.71%
jan 1, 1989
29.398
-1.277
-4.16%
jan 1, 1990
28.604
-0.794
-2.7%
jan 1, 1991
29.079
+0.475
1.66%
jan 1, 1992
28.585
-0.494
-1.7%
jan 1, 1993
27.115
-1.47
-5.14%
jan 1, 1994
26.656
-0.459
-1.69%
jan 1, 1995
30.987
+4.331
16.25%
jan 1, 1996
31.734
+0.747
2.41%
jan 1, 1997
26.229
-5.505
-17.35%
jan 1, 1998
25.163
-1.065
-4.06%
jan 1, 1999
23.024
-2.14
-8.5%
jan 1, 2000
15.974
-7.05
-30.62%
jan 1, 2001
15.846
-0.128
-0.8%
jan 1, 2002
12.787
-3.058
-19.3%
jan 1, 2003
16.092
+3.305
25.85%
jan 1, 2004
20.437
+4.345
27.0%
jan 1, 2005
7.708
-12.729
-62.28%
jan 1, 2006
9.687
+1.979
25.67%
jan 1, 2007
3.041
-6.646
-68.61%
jan 1, 2008
4.087
+1.046
34.39%
jan 1, 2009
4.671
+0.584
14.29%
jan 1, 2010
2.43
-2.241
-47.98%
jan 1, 2011
1.745
-0.685
-28.2%
jan 1, 2012
1.772
+0.028
1.58%
jan 1, 2013
1.751
-0.022
-1.23%
jan 1, 2014
3.052
+1.301
74.33%
Ranking of countries by current statistics by years


Comments: