29
/
en
AIzaSyAYiBZKx7MnpbEhh9jyipgxe19OcubqV5w
April 1, 2024
112065
Costa Rica
CRI
true
2
1
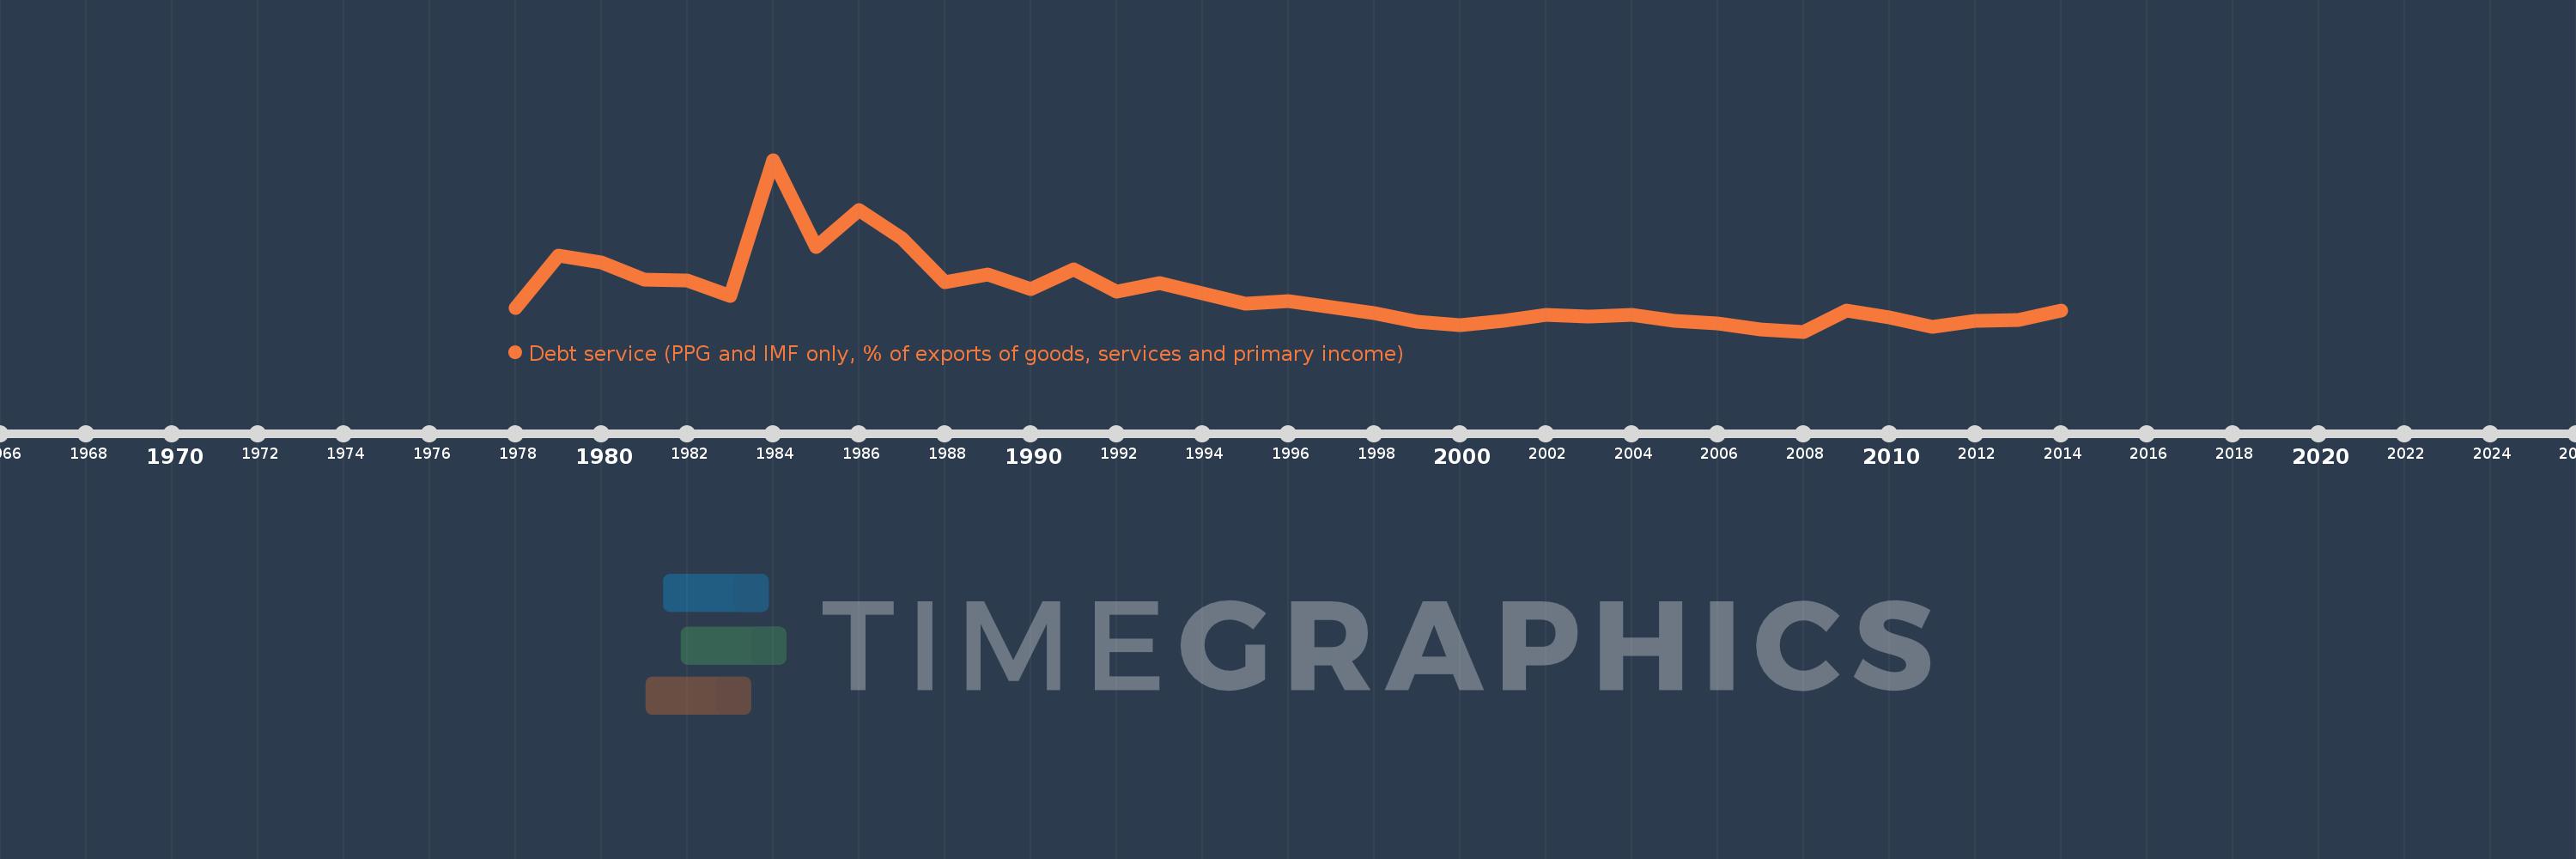
Debt service (PPG and IMF only, % of exports of goods, services and primary income)
2014,2013,2012,2011,2010,2009,2008,2007,2006,2005,2004,2003,2002,2001,2000,1999,1998,1997,1996,1995,1994,1993,1992,1991,1990,1989,1988,1987,1986,1985,1984,1983,1982,1981,1980,1979,1978
This statistics in other country:
Timeline:
This timeline shows a graph from 1978 to 2014 of Costa Rica. No data until 1977. Number of actual observations by date: 37.
Source name:
World Development Indicators
Source organization:
World Bank, International Debt Statistics.
Categories, topics:
External Debt
Last updated:
apr 23, 2017
Indicators value changes by year
Maximum:
55.469
jan 1, 1984
At the date of observation
Value
Absolute change
Change from previous value
jan 1, 1978
10.794
+10.794
0.0%
jan 1, 1979
26.554
+15.76
146.01%
jan 1, 1980
24.652
-1.903
-7.17%
jan 1, 1981
19.502
-5.149
-20.89%
jan 1, 1982
19.145
-0.358
-1.83%
jan 1, 1983
14.382
-4.763
-24.88%
jan 1, 1984
55.469
+41.087
285.68%
jan 1, 1985
29.24
-26.229
-47.29%
jan 1, 1986
40.255
+11.015
37.67%
jan 1, 1987
31.861
-8.394
-20.85%
jan 1, 1988
18.599
-13.262
-41.62%
jan 1, 1989
20.997
+2.397
12.89%
jan 1, 1990
16.62
-4.376
-20.84%
jan 1, 1991
22.621
+6.001
36.1%
jan 1, 1992
15.815
-6.805
-30.09%
jan 1, 1993
18.38
+2.564
16.21%
jan 1, 1994
15.205
-3.175
-17.27%
jan 1, 1995
12.267
-2.938
-19.33%
jan 1, 1996
12.877
+0.61
4.98%
jan 1, 1997
10.998
-1.879
-14.59%
jan 1, 1998
9.262
-1.736
-15.79%
jan 1, 1999
6.801
-2.461
-26.57%
jan 1, 2000
5.796
-1.005
-14.77%
jan 1, 2001
7.088
+1.292
22.29%
jan 1, 2002
8.89
+1.803
25.43%
jan 1, 2003
8.303
-0.588
-6.61%
jan 1, 2004
8.864
+0.562
6.76%
jan 1, 2005
6.988
-1.877
-21.17%
jan 1, 2006
6.25
-0.738
-10.56%
jan 1, 2007
4.324
-1.926
-30.82%
jan 1, 2008
3.752
-0.571
-13.22%
jan 1, 2009
10.074
+6.322
168.49%
jan 1, 2010
8.003
-2.072
-20.56%
jan 1, 2011
5.143
-2.86
-35.73%
jan 1, 2012
7.1
+1.957
38.05%
jan 1, 2013
7.258
+0.158
2.23%
jan 1, 2014
10.178
+2.92
40.23%
Ranking of countries by current statistics by years


Comments: