29
/
en
AIzaSyAYiBZKx7MnpbEhh9jyipgxe19OcubqV5w
April 1, 2024
252878
Sudan
SDN
true
2
1
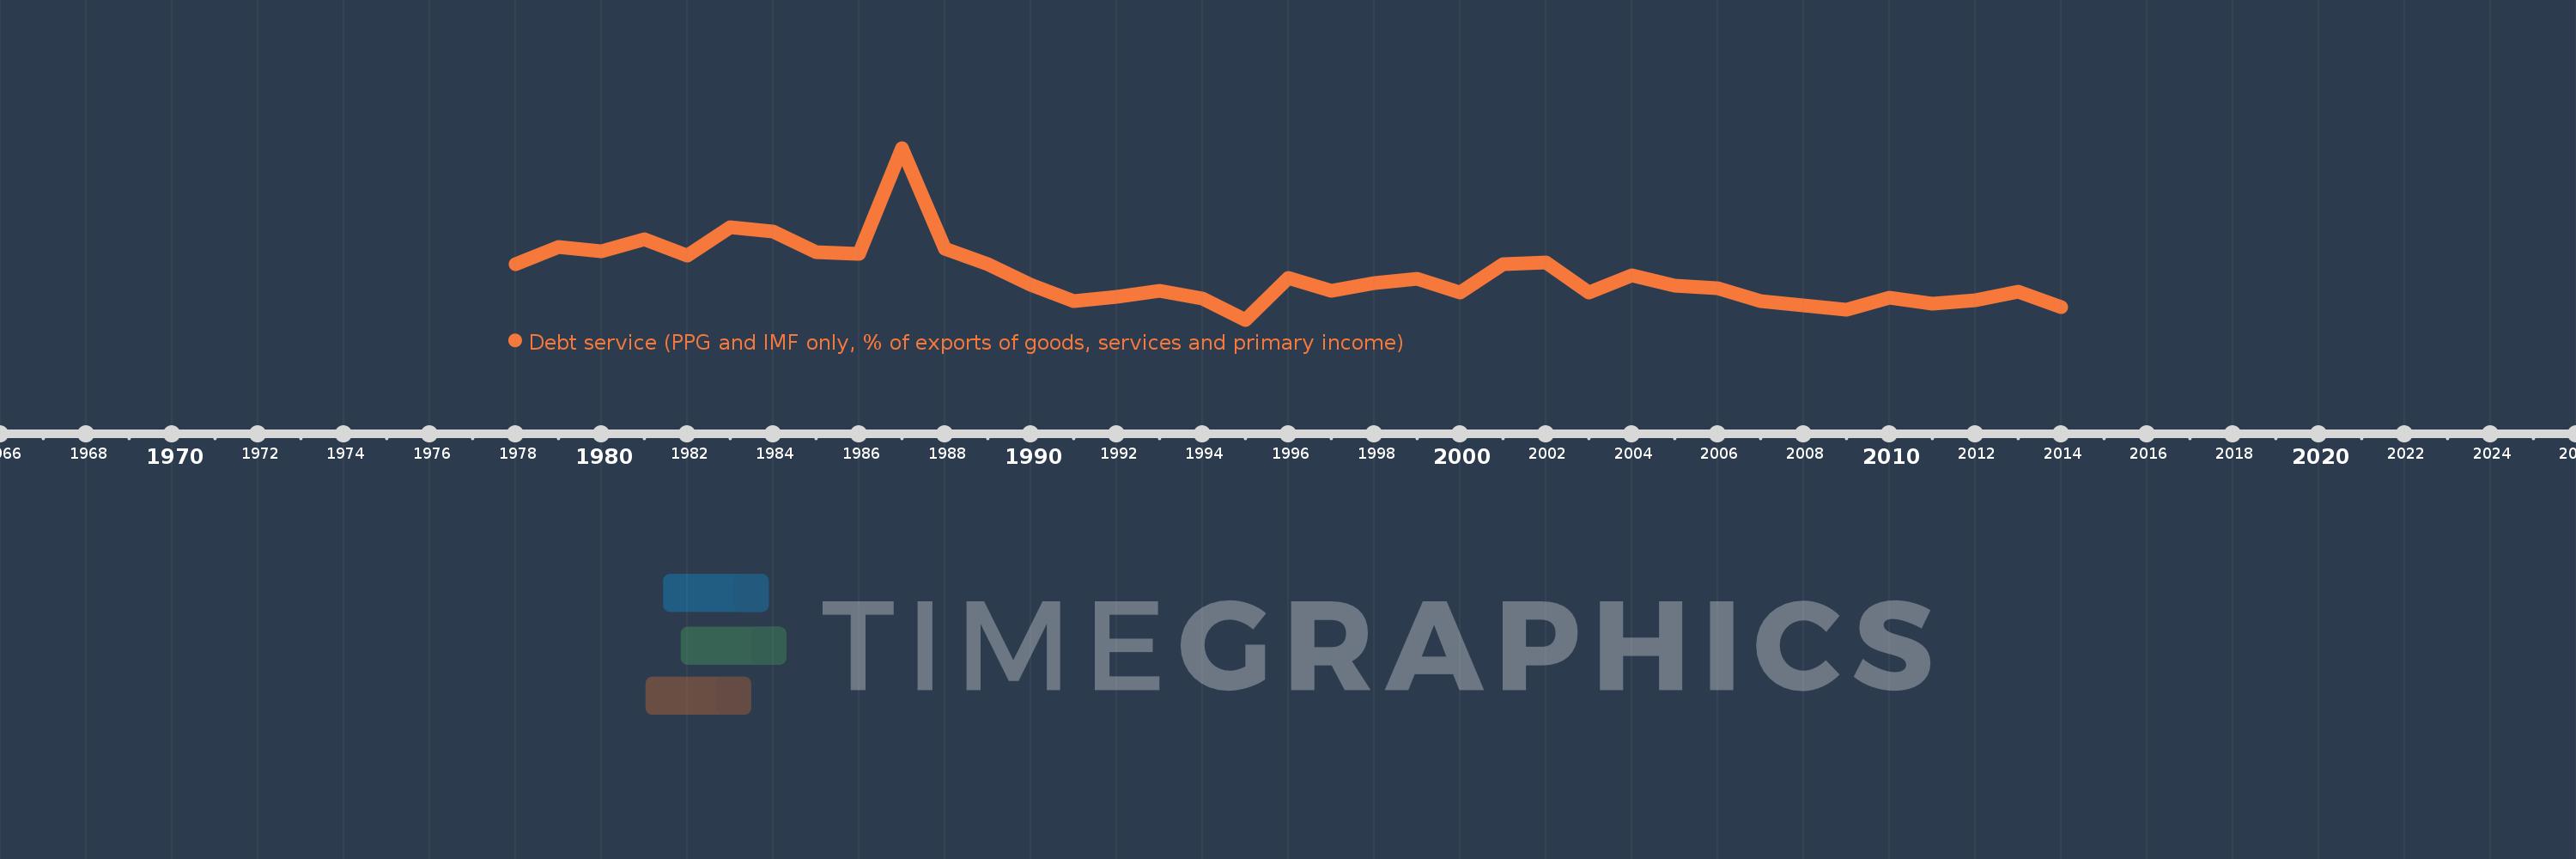
Debt service (PPG and IMF only, % of exports of goods, services and primary income)
2014,2013,2012,2011,2010,2009,2008,2007,2006,2005,2004,2003,2002,2001,2000,1999,1998,1997,1996,1995,1994,1993,1992,1991,1990,1989,1988,1987,1986,1985,1984,1983,1982,1981,1980,1979,1978
This statistics in other country:
Timeline:
This timeline shows a graph from 1978 to 2014 of Sudan. No data until 1977. Number of actual observations by date: 37.
Source name:
World Development Indicators
Source organization:
World Bank, International Debt Statistics.
Categories, topics:
External Debt
Last updated:
apr 23, 2017
Indicators value changes by year
Maximum:
39.614
jan 1, 1987
At the date of observation
Value
Absolute change
Change from previous value
jan 1, 1978
13.234
+13.234
0.0%
jan 1, 1979
17.178
+3.944
29.8%
jan 1, 1980
16.18
-0.997
-5.81%
jan 1, 1981
18.811
+2.63
16.26%
jan 1, 1982
15.131
-3.68
-19.56%
jan 1, 1983
21.587
+6.456
42.67%
jan 1, 1984
20.644
-0.943
-4.37%
jan 1, 1985
15.827
-4.817
-23.33%
jan 1, 1986
15.566
-0.261
-1.65%
jan 1, 1987
39.614
+24.048
154.49%
jan 1, 1988
16.736
-22.878
-57.75%
jan 1, 1989
13.157
-3.579
-21.38%
jan 1, 1990
8.577
-4.58
-34.81%
jan 1, 1991
4.822
-3.755
-43.78%
jan 1, 1992
5.797
+0.975
20.23%
jan 1, 1993
7.207
+1.409
24.31%
jan 1, 1994
5.384
-1.823
-25.29%
jan 1, 1995
0.536
-4.848
-90.04%
jan 1, 1996
10.103
+9.566
1.78K%
jan 1, 1997
7.067
-3.036
-30.05%
jan 1, 1998
8.953
+1.886
26.69%
jan 1, 1999
9.789
+0.836
9.33%
jan 1, 2000
6.77
-3.019
-30.84%
jan 1, 2001
13.179
+6.409
94.68%
jan 1, 2002
13.571
+0.392
2.97%
jan 1, 2003
6.75
-6.821
-50.26%
jan 1, 2004
10.574
+3.824
56.65%
jan 1, 2005
8.236
-2.338
-22.11%
jan 1, 2006
7.699
-0.537
-6.52%
jan 1, 2007
4.855
-2.844
-36.94%
jan 1, 2008
3.817
-1.038
-21.38%
jan 1, 2009
2.905
-0.912
-23.89%
jan 1, 2010
5.626
+2.721
93.68%
jan 1, 2011
4.138
-1.489
-26.46%
jan 1, 2012
5.017
+0.879
21.24%
jan 1, 2013
6.946
+1.93
38.47%
jan 1, 2014
3.494
-3.453
-49.71%
Ranking of countries by current statistics by years


Comments: