29
/
en
AIzaSyAYiBZKx7MnpbEhh9jyipgxe19OcubqV5w
April 1, 2024
264434
Togo
TGO
true
2
1
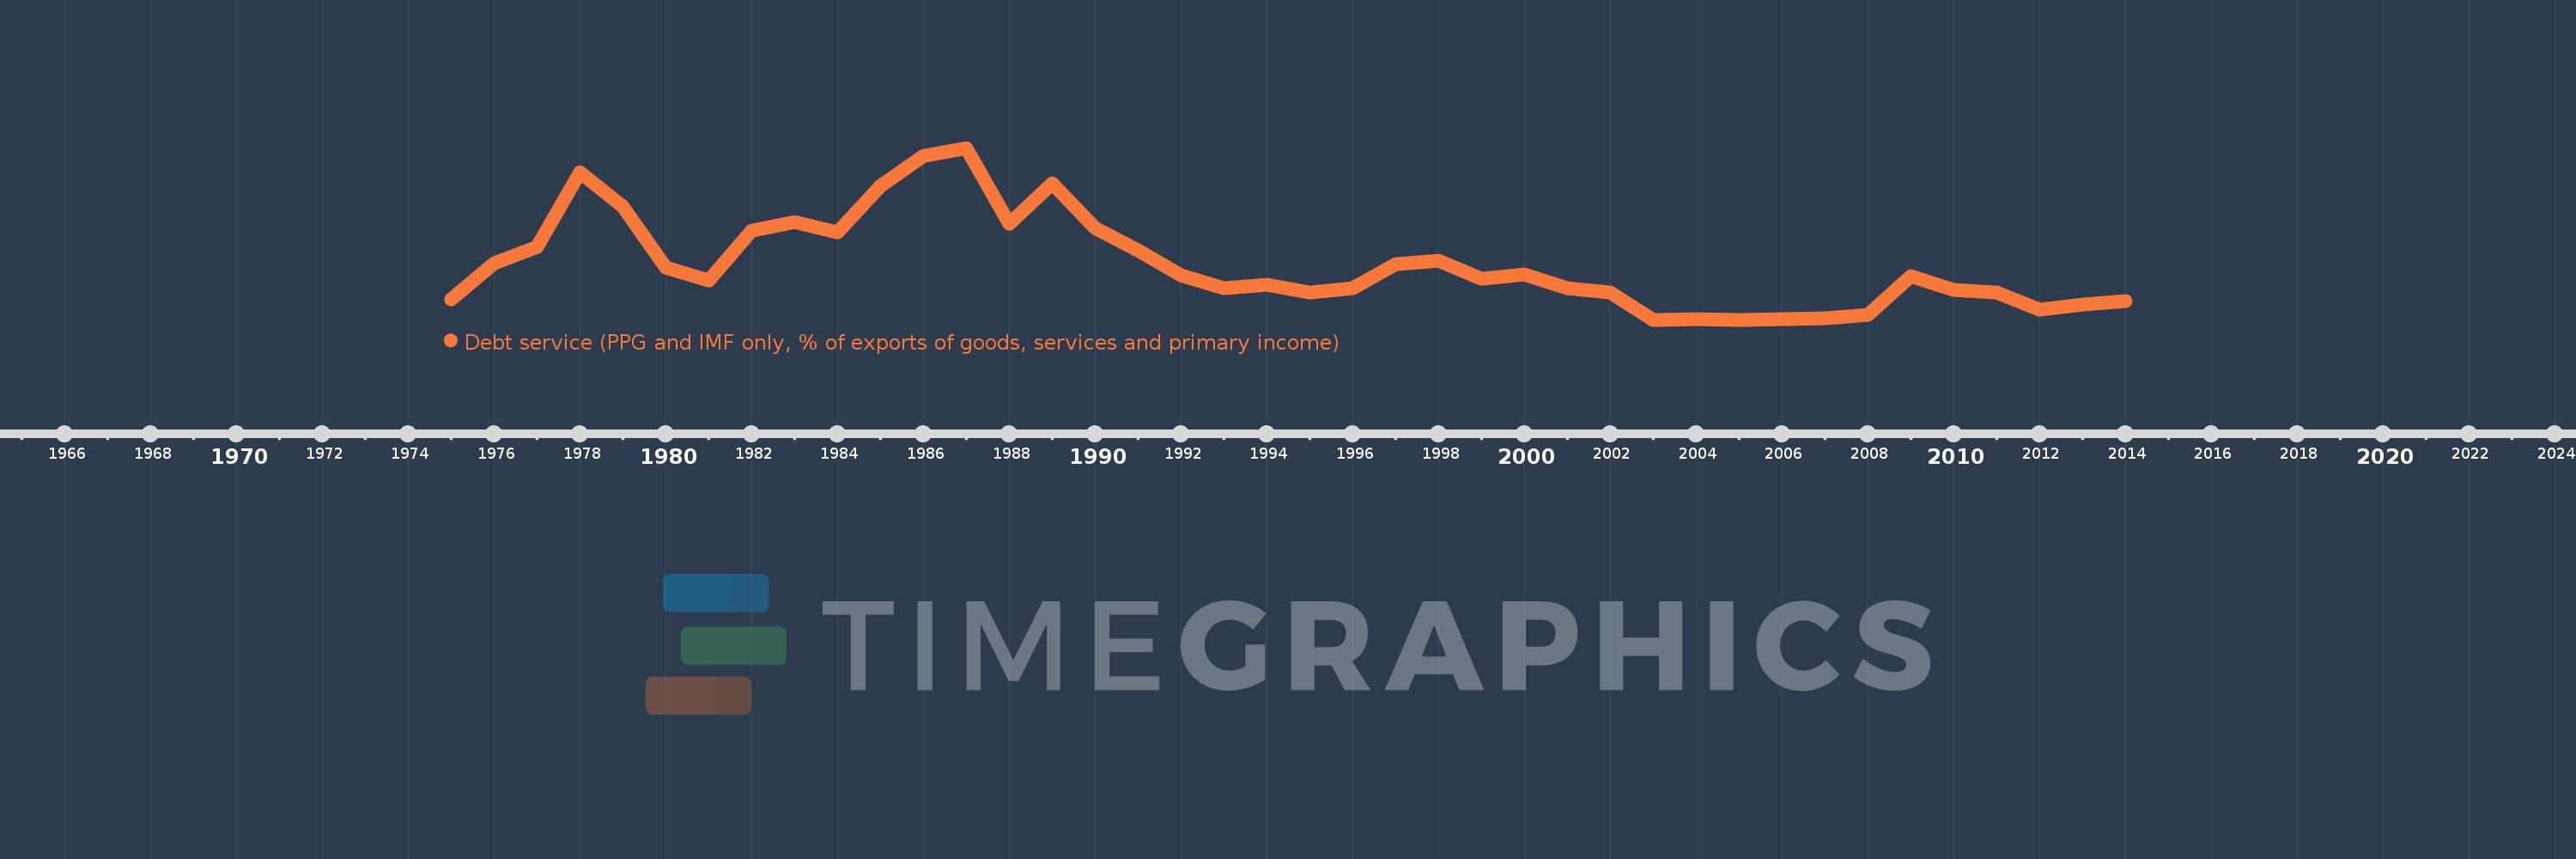
Debt service (PPG and IMF only, % of exports of goods, services and primary income)
2014,2013,2012,2011,2010,2009,2008,2007,2006,2005,2004,2003,2002,2001,2000,1999,1998,1997,1996,1995,1994,1993,1992,1991,1990,1989,1988,1987,1986,1985,1984,1983,1982,1981,1980,1979,1978,1977,1976,1975
This statistics in other country:
Timeline:
This timeline shows a graph from 1975 to 2014 of Togo. No data until 1974. Number of actual observations by date: 40.
Source name:
World Development Indicators
Source organization:
World Bank, International Debt Statistics.
Categories, topics:
External Debt
Last updated:
apr 23, 2017
Indicators value changes by year
At the date of observation
Value
Absolute change
Change from previous value
jan 1, 1975
3.623
+3.623
0.0%
jan 1, 1976
9.462
+5.839
161.17%
jan 1, 1977
12.164
+2.702
28.56%
jan 1, 1978
24.247
+12.083
99.34%
jan 1, 1979
18.706
-5.542
-22.85%
jan 1, 1980
8.717
-9.989
-53.4%
jan 1, 1981
6.653
-2.064
-23.68%
jan 1, 1982
14.68
+8.027
120.66%
jan 1, 1983
16.081
+1.401
9.54%
jan 1, 1984
14.404
-1.677
-10.43%
jan 1, 1985
21.973
+7.569
52.54%
jan 1, 1986
26.875
+4.902
22.31%
jan 1, 1987
28.14
+1.265
4.71%
jan 1, 1988
15.818
-12.322
-43.79%
jan 1, 1989
22.381
+6.564
41.5%
jan 1, 1990
15.189
-7.192
-32.13%
jan 1, 1991
11.478
-3.712
-24.44%
jan 1, 1992
7.52
-3.958
-34.49%
jan 1, 1993
5.432
-2.087
-27.76%
jan 1, 1994
6.014
+0.582
10.71%
jan 1, 1995
4.715
-1.3
-21.61%
jan 1, 1996
5.424
+0.709
15.04%
jan 1, 1997
9.266
+3.842
70.84%
jan 1, 1998
9.821
+0.555
5.99%
jan 1, 1999
6.978
-2.844
-28.95%
jan 1, 2000
7.622
+0.644
9.23%
jan 1, 2001
5.465
-2.156
-28.29%
jan 1, 2002
4.686
-0.779
-14.26%
jan 1, 2003
0.336
-4.35
-92.83%
jan 1, 2004
0.465
+0.129
38.37%
jan 1, 2005
0.313
-0.152
-32.69%
jan 1, 2006
0.361
+0.048
15.41%
jan 1, 2007
0.597
+0.236
65.35%
jan 1, 2008
1.097
+0.5
83.71%
jan 1, 2009
7.41
+6.314
575.68%
jan 1, 2010
5.095
-2.315
-31.24%
jan 1, 2011
4.728
-0.367
-7.2%
jan 1, 2012
2.006
-2.723
-57.58%
jan 1, 2013
2.801
+0.795
39.65%
jan 1, 2014
3.377
+0.576
20.56%
Ranking of countries by current statistics by years


Comments: