29
/
en
AIzaSyAYiBZKx7MnpbEhh9jyipgxe19OcubqV5w
April 1, 2024
204007
Myanmar
MMR
true
2
1
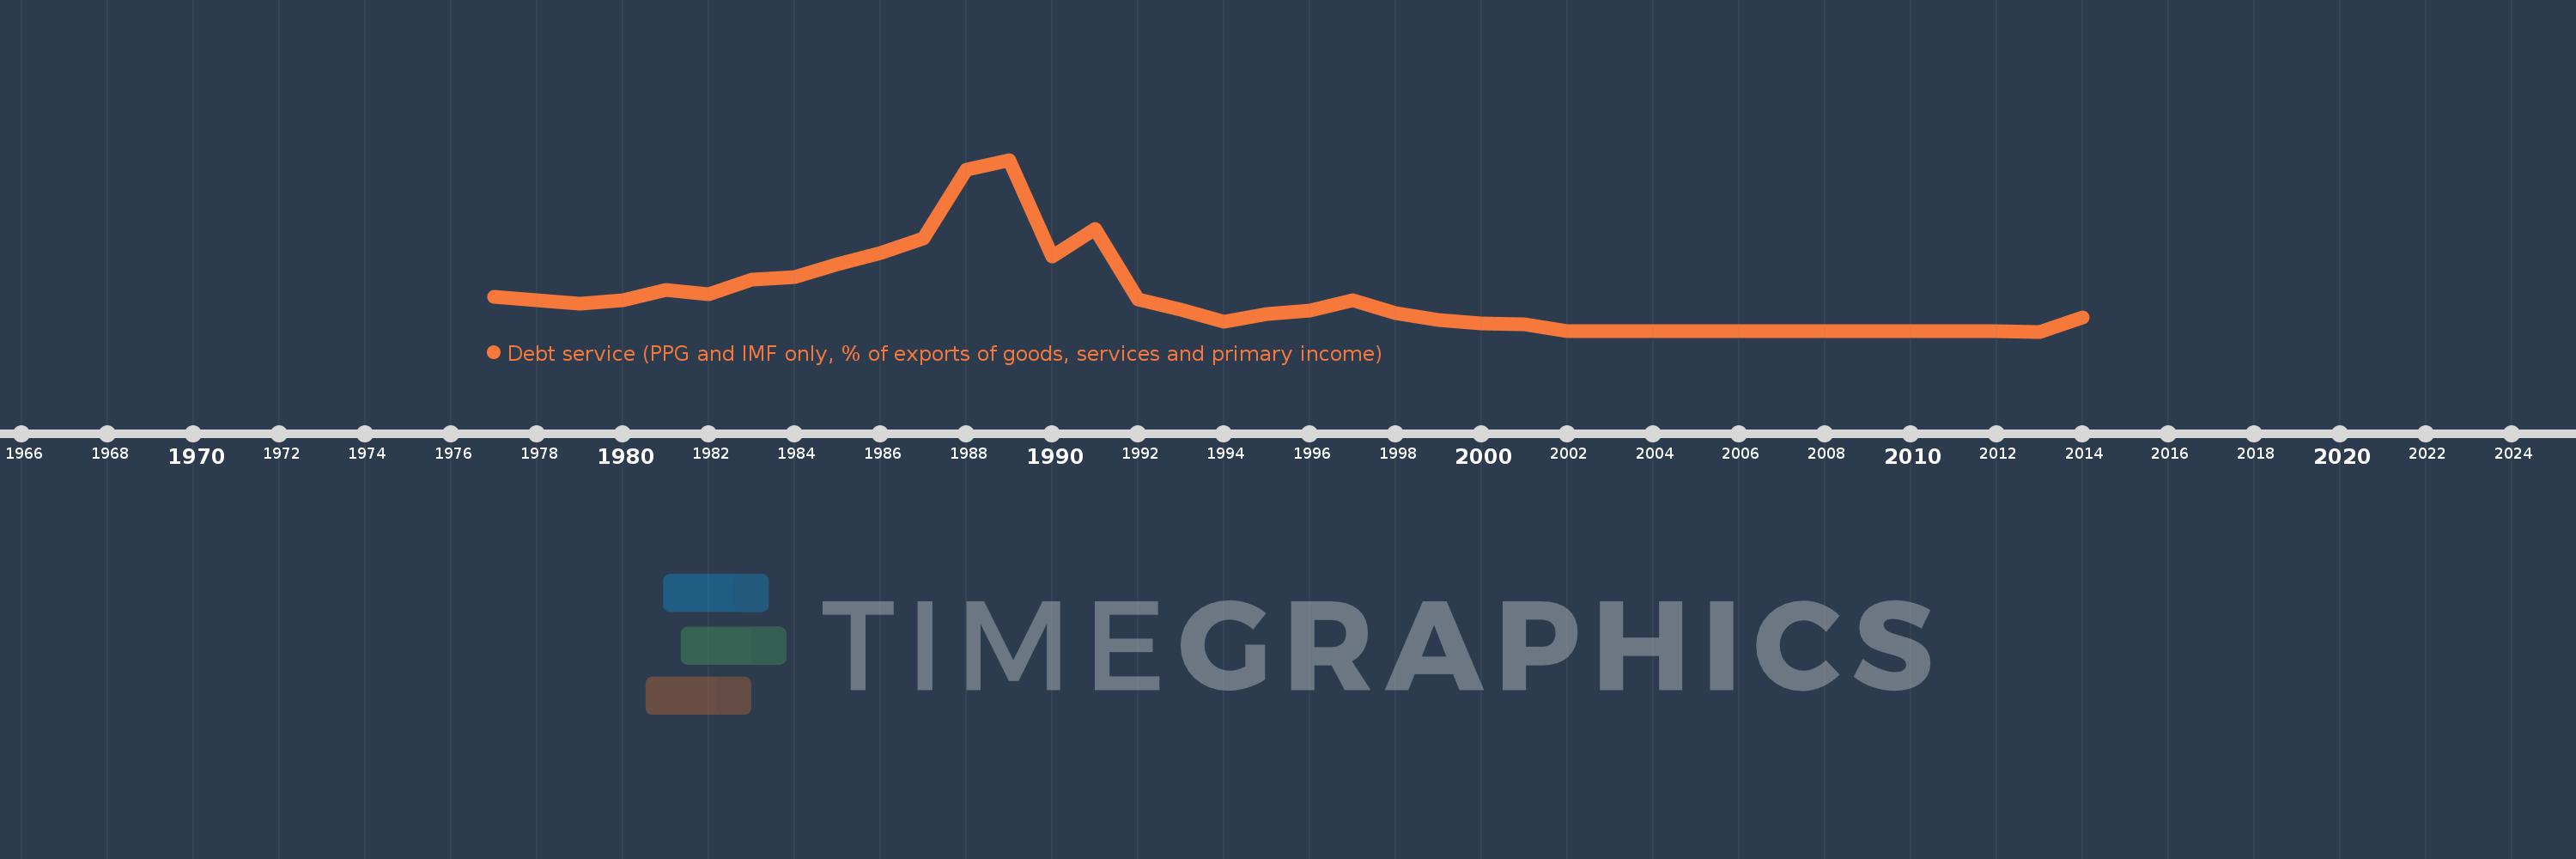
Debt service (PPG and IMF only, % of exports of goods, services and primary income)
2014,2013,2012,2011,2010,2009,2008,2007,2006,2005,2004,2003,2002,2001,2000,1999,1998,1997,1996,1995,1994,1993,1992,1991,1990,1989,1988,1987,1986,1985,1984,1983,1982,1981,1980,1979,1978,1977
This statistics in other country:
Timeline:
This timeline shows a graph from 1977 to 2014 of Myanmar. No data until 1976. Number of actual observations by date: 38.
Source name:
World Development Indicators
Source organization:
World Bank, International Debt Statistics.
Categories, topics:
External Debt
Last updated:
apr 23, 2017
Indicators value changes by year
Maximum:
100.626
jan 1, 1989
At the date of observation
Value
Absolute change
Change from previous value
jan 1, 1977
20.497
+20.497
0.0%
jan 1, 1978
18.281
-2.216
-10.81%
jan 1, 1979
16.467
-1.814
-9.92%
jan 1, 1980
18.445
+1.978
12.01%
jan 1, 1981
24.485
+6.04
32.74%
jan 1, 1982
21.82
-2.665
-10.88%
jan 1, 1983
30.497
+8.678
39.77%
jan 1, 1984
31.967
+1.469
4.82%
jan 1, 1985
39.517
+7.55
23.62%
jan 1, 1986
46.175
+6.658
16.85%
jan 1, 1987
54.647
+8.472
18.35%
jan 1, 1988
94.766
+40.12
73.42%
jan 1, 1989
100.626
+5.86
6.18%
jan 1, 1990
44.232
-56.395
-56.04%
jan 1, 1991
59.958
+15.726
35.55%
jan 1, 1992
19.034
-40.924
-68.25%
jan 1, 1993
12.715
-6.319
-33.2%
jan 1, 1994
5.874
-6.841
-53.8%
jan 1, 1995
10.105
+4.231
72.04%
jan 1, 1996
12.556
+2.45
24.25%
jan 1, 1997
18.205
+5.649
44.99%
jan 1, 1998
10.607
-7.598
-41.74%
jan 1, 1999
6.806
-3.801
-35.84%
jan 1, 2000
4.762
-2.043
-30.02%
jan 1, 2001
4.188
-0.575
-12.07%
jan 1, 2002
0.32
-3.868
-92.36%
jan 1, 2003
0.172
-0.148
-46.1%
jan 1, 2004
0.202
+0.029
16.89%
jan 1, 2005
0.156
-0.046
-22.85%
jan 1, 2006
0.119
-0.036
-23.29%
jan 1, 2007
0.108
-0.012
-9.78%
jan 1, 2008
0.097
-0.01
-9.64%
jan 1, 2009
0.133
+0.036
36.85%
jan 1, 2010
0.095
-0.038
-28.76%
jan 1, 2011
0.08
-0.015
-15.46%
jan 1, 2012
0.042
-0.038
-47.28%
jan 1, 2013
0.02
-0.022
-51.61%
jan 1, 2014
8.181
+8.161
39.9K%
Ranking of countries by current statistics by years


Comments: