29
/
en
AIzaSyAYiBZKx7MnpbEhh9jyipgxe19OcubqV5w
April 1, 2024
87044
Bolivia
BOL
true
2
1
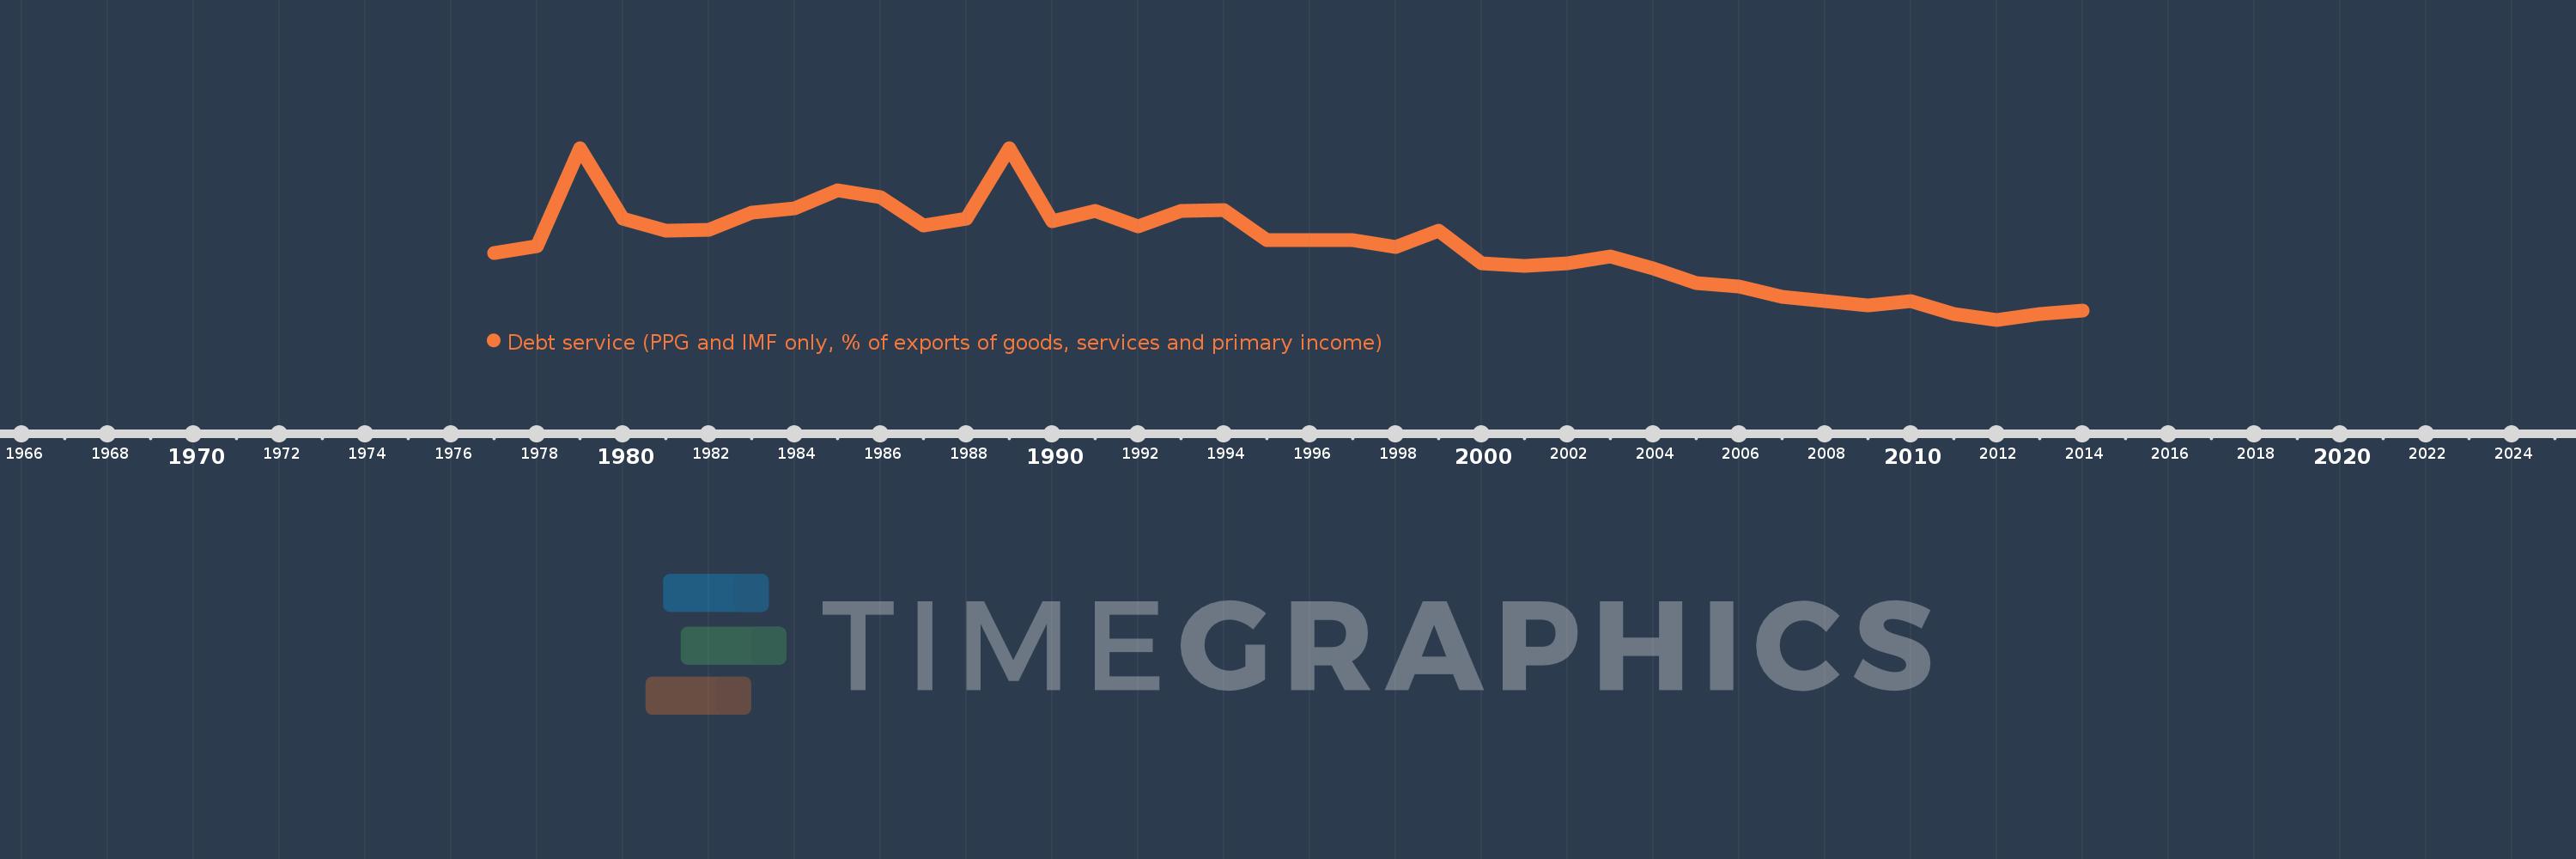
Debt service (PPG and IMF only, % of exports of goods, services and primary income)
2014,2013,2012,2011,2010,2009,2008,2007,2006,2005,2004,2003,2002,2001,2000,1999,1998,1997,1996,1995,1994,1993,1992,1991,1990,1989,1988,1987,1986,1985,1984,1983,1982,1981,1980,1979,1978,1977
This statistics in other country:
Timeline:
This timeline shows a graph from 1977 to 2014 of Bolivia. No data until 1976. Number of actual observations by date: 38.
Source name:
World Development Indicators
Source organization:
World Bank, International Debt Statistics.
Categories, topics:
External Debt
Last updated:
apr 23, 2017
Indicators value changes by year
Maximum:
52.579
jan 1, 1989
At the date of observation
Value
Absolute change
Change from previous value
jan 1, 1977
21.846
+21.846
0.0%
jan 1, 1978
23.898
+2.052
9.39%
jan 1, 1979
52.439
+28.541
119.43%
jan 1, 1980
31.922
-20.517
-39.13%
jan 1, 1981
28.489
-3.433
-10.75%
jan 1, 1982
28.83
+0.341
1.2%
jan 1, 1983
33.638
+4.809
16.68%
jan 1, 1984
35.008
+1.37
4.07%
jan 1, 1985
40.213
+5.205
14.87%
jan 1, 1986
38.324
-1.89
-4.7%
jan 1, 1987
29.964
-8.359
-21.81%
jan 1, 1988
32.009
+2.045
6.82%
jan 1, 1989
52.579
+20.57
64.26%
jan 1, 1990
31.214
-21.364
-40.63%
jan 1, 1991
34.171
+2.956
9.47%
jan 1, 1992
29.736
-4.435
-12.98%
jan 1, 1993
34.344
+4.608
15.5%
jan 1, 1994
34.382
+0.039
0.11%
jan 1, 1995
25.733
-8.649
-25.16%
jan 1, 1996
25.749
+0.016
0.06%
jan 1, 1997
25.607
-0.142
-0.55%
jan 1, 1998
23.775
-1.832
-7.15%
jan 1, 1999
28.577
+4.801
20.19%
jan 1, 2000
19.033
-9.544
-33.4%
jan 1, 2001
18.251
-0.781
-4.11%
jan 1, 2002
19.053
+0.801
4.39%
jan 1, 2003
21.079
+2.026
10.64%
jan 1, 2004
17.504
-3.575
-16.96%
jan 1, 2005
13.301
-4.203
-24.01%
jan 1, 2006
12.293
-1.008
-7.58%
jan 1, 2007
9.3
-2.993
-24.35%
jan 1, 2008
7.986
-1.315
-14.13%
jan 1, 2009
6.738
-1.248
-15.63%
jan 1, 2010
7.848
+1.111
16.49%
jan 1, 2011
4.21
-3.638
-46.36%
jan 1, 2012
2.509
-1.701
-40.4%
jan 1, 2013
4.153
+1.643
65.5%
jan 1, 2014
5.284
+1.131
27.24%
Ranking of countries by current statistics by years


Comments: