29
/
en
AIzaSyAYiBZKx7MnpbEhh9jyipgxe19OcubqV5w
April 1, 2024
272081
Uganda
UGA
true
2
1
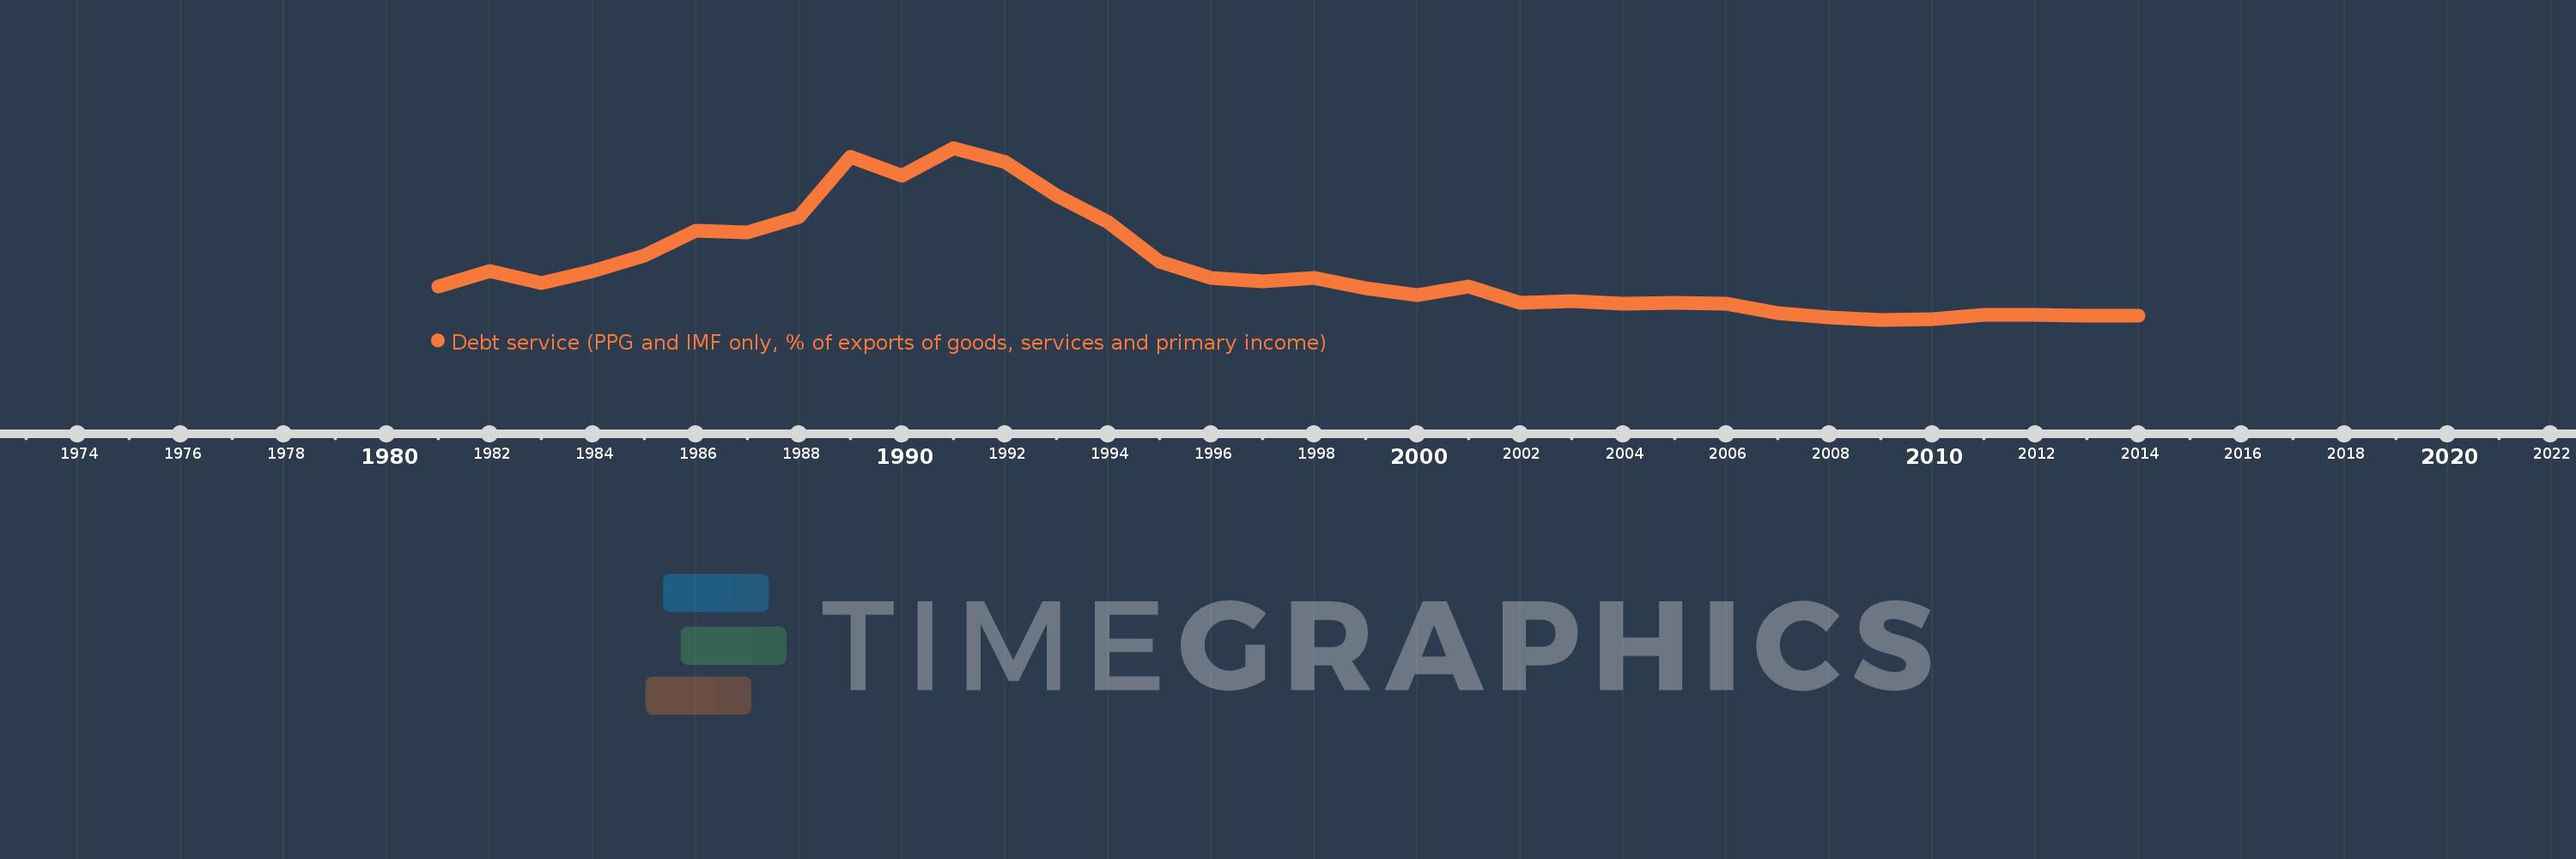
Debt service (PPG and IMF only, % of exports of goods, services and primary income)
2014,2013,2012,2011,2010,2009,2008,2007,2006,2005,2004,2003,2002,2001,2000,1999,1998,1997,1996,1995,1994,1993,1992,1991,1990,1989,1988,1987,1986,1985,1984,1983,1982,1981
This statistics in other country:
Timeline:
This timeline shows a graph from 1981 to 2014 of Uganda. No data until 1980. Number of actual observations by date: 34.
Source name:
World Development Indicators
Source organization:
World Bank, International Debt Statistics.
Categories, topics:
External Debt
Last updated:
apr 23, 2017
Indicators value changes by year
Maximum:
78.639
jan 1, 1991
At the date of observation
Value
Absolute change
Change from previous value
jan 1, 1981
15.749
+15.749
0.0%
jan 1, 1982
22.823
+7.074
44.92%
jan 1, 1983
17.082
-5.741
-25.16%
jan 1, 1984
22.722
+5.64
33.02%
jan 1, 1985
29.795
+7.074
31.13%
jan 1, 1986
41.139
+11.344
38.07%
jan 1, 1987
40.242
-0.897
-2.18%
jan 1, 1988
47.211
+6.969
17.32%
jan 1, 1989
74.596
+27.385
58.01%
jan 1, 1990
66.12
-8.477
-11.36%
jan 1, 1991
78.639
+12.519
18.93%
jan 1, 1992
72.257
-6.382
-8.12%
jan 1, 1993
56.936
-15.322
-21.2%
jan 1, 1994
45.007
-11.929
-20.95%
jan 1, 1995
27.008
-17.999
-39.99%
jan 1, 1996
19.538
-7.469
-27.66%
jan 1, 1997
17.876
-1.662
-8.51%
jan 1, 1998
19.701
+1.825
10.21%
jan 1, 1999
15.0
-4.701
-23.86%
jan 1, 2000
11.759
-3.241
-21.61%
jan 1, 2001
15.684
+3.925
33.38%
jan 1, 2002
8.301
-7.383
-47.08%
jan 1, 2003
8.994
+0.694
8.36%
jan 1, 2004
7.957
-1.037
-11.53%
jan 1, 2005
8.15
+0.193
2.43%
jan 1, 2006
7.792
-0.358
-4.39%
jan 1, 2007
3.716
-4.076
-52.31%
jan 1, 2008
1.585
-2.131
-57.35%
jan 1, 2009
0.55
-1.035
-65.32%
jan 1, 2010
0.808
+0.259
47.06%
jan 1, 2011
2.672
+1.863
230.5%
jan 1, 2012
2.6
-0.072
-2.7%
jan 1, 2013
2.441
-0.158
-6.09%
jan 1, 2014
2.318
-0.123
-5.06%
Ranking of countries by current statistics by years


Comments: