29
/
en
AIzaSyAYiBZKx7MnpbEhh9jyipgxe19OcubqV5w
April 1, 2024
219459
Papua New Guinea
PNG
true
2
1
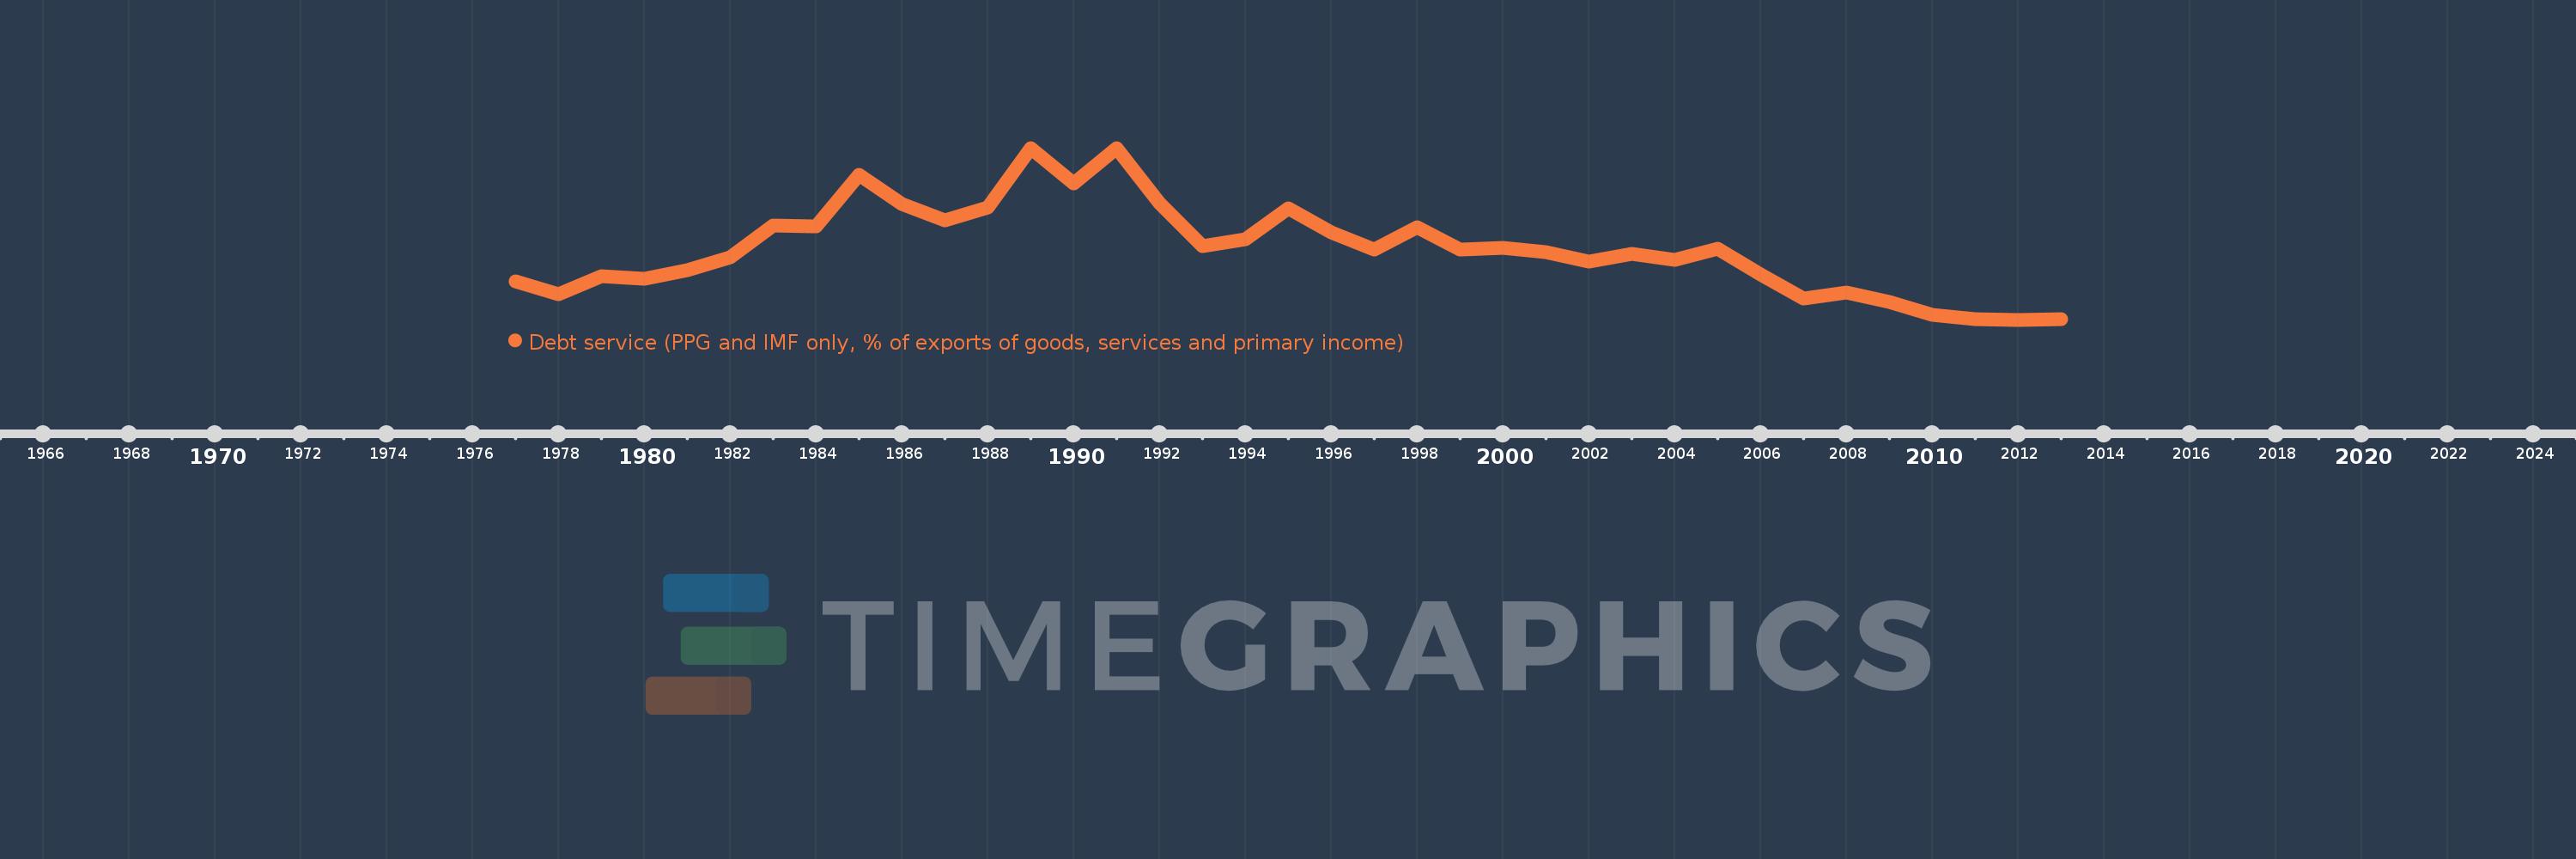
Debt service (PPG and IMF only, % of exports of goods, services and primary income)
2013,2012,2011,2010,2009,2008,2007,2006,2005,2004,2003,2002,2001,2000,1999,1998,1997,1996,1995,1994,1993,1992,1991,1990,1989,1988,1987,1986,1985,1984,1983,1982,1981,1980,1979,1978,1977
This statistics in other country:
Timeline:
This timeline shows a graph from 1977 to 2013 of Papua New Guinea. No data until 1976. Number of actual observations by date: 37.
Source name:
World Development Indicators
Source organization:
World Bank, International Debt Statistics.
Categories, topics:
External Debt
Last updated:
apr 23, 2017
Indicators value changes by year
Maximum:
18.426
jan 1, 1989
At the date of observation
Value
Absolute change
Change from previous value
jan 1, 1977
5.171
+5.171
0.0%
jan 1, 1978
3.847
-1.324
-25.61%
jan 1, 1979
5.689
+1.842
47.88%
jan 1, 1980
5.451
-0.237
-4.17%
jan 1, 1981
6.304
+0.852
15.64%
jan 1, 1982
7.538
+1.235
19.59%
jan 1, 1983
10.716
+3.178
42.15%
jan 1, 1984
10.612
-0.104
-0.97%
jan 1, 1985
15.725
+5.113
48.18%
jan 1, 1986
12.875
-2.85
-18.12%
jan 1, 1987
11.206
-1.67
-12.97%
jan 1, 1988
12.484
+1.278
11.41%
jan 1, 1989
18.426
+5.943
47.6%
jan 1, 1990
14.887
-3.539
-19.21%
jan 1, 1991
18.376
+3.489
23.43%
jan 1, 1992
12.915
-5.461
-29.72%
jan 1, 1993
8.693
-4.222
-32.69%
jan 1, 1994
9.313
+0.62
7.13%
jan 1, 1995
12.457
+3.145
33.77%
jan 1, 1996
10.066
-2.391
-19.19%
jan 1, 1997
8.333
-1.733
-17.22%
jan 1, 1998
10.566
+2.233
26.8%
jan 1, 1999
8.341
-2.226
-21.06%
jan 1, 2000
8.469
+0.128
1.54%
jan 1, 2001
8.037
-0.432
-5.1%
jan 1, 2002
7.086
-0.95
-11.82%
jan 1, 2003
7.857
+0.77
10.87%
jan 1, 2004
7.302
-0.555
-7.06%
jan 1, 2005
8.373
+1.071
14.67%
jan 1, 2006
5.88
-2.494
-29.78%
jan 1, 2007
3.456
-2.424
-41.22%
jan 1, 2008
4.059
+0.603
17.44%
jan 1, 2009
3.12
-0.939
-23.13%
jan 1, 2010
1.81
-1.31
-41.99%
jan 1, 2011
1.384
-0.425
-23.5%
jan 1, 2012
1.338
-0.047
-3.39%
jan 1, 2013
1.403
+0.066
4.92%
Ranking of countries by current statistics by years


Comments: