29
/
en
AIzaSyAYiBZKx7MnpbEhh9jyipgxe19OcubqV5w
April 1, 2024
125993
El Salvador
SLV
true
2
1
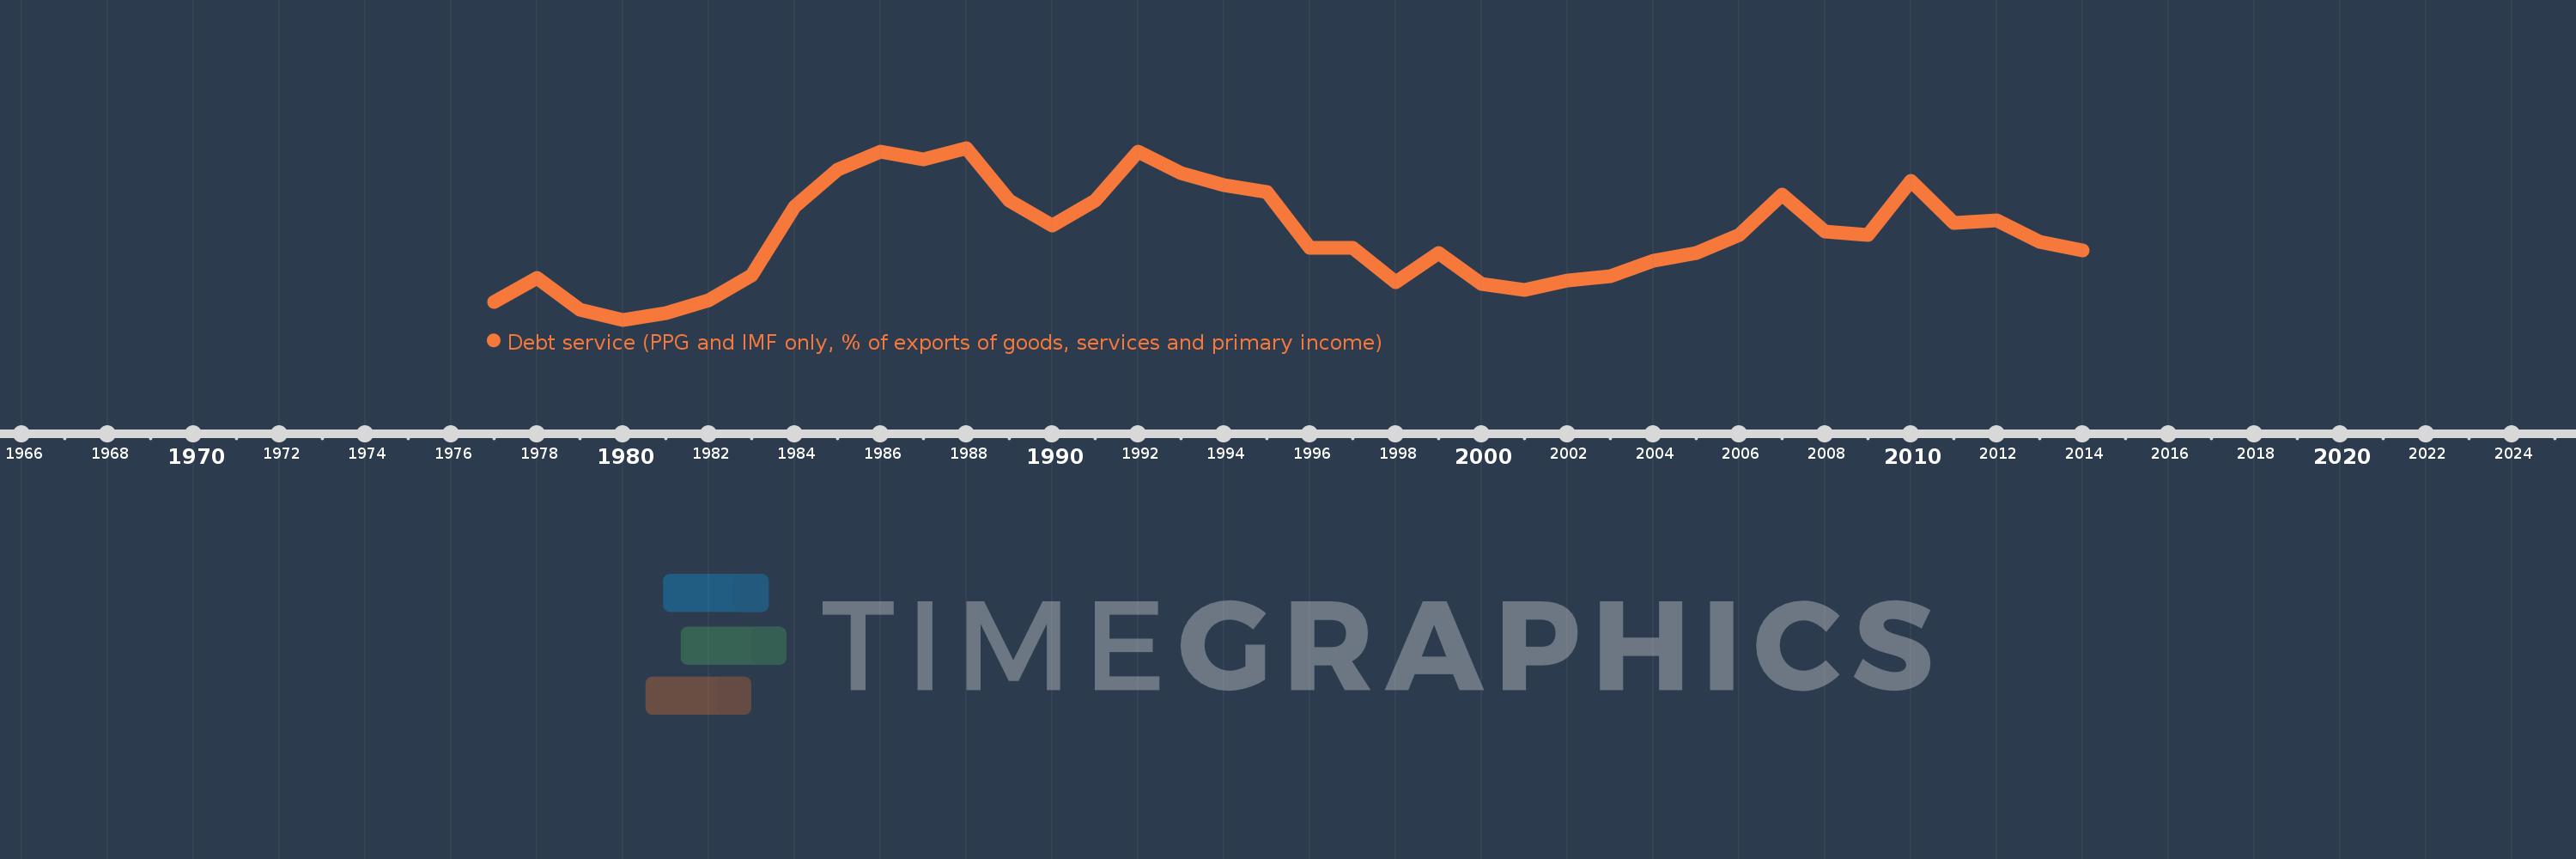
Debt service (PPG and IMF only, % of exports of goods, services and primary income)
2014,2013,2012,2011,2010,2009,2008,2007,2006,2005,2004,2003,2002,2001,2000,1999,1998,1997,1996,1995,1994,1993,1992,1991,1990,1989,1988,1987,1986,1985,1984,1983,1982,1981,1980,1979,1978,1977
This statistics in other country:
Timeline:
This timeline shows a graph from 1977 to 2014 of El Salvador. No data until 1976. Number of actual observations by date: 38.
Source name:
World Development Indicators
Source organization:
World Bank, International Debt Statistics.
Categories, topics:
External Debt
Last updated:
apr 23, 2017
Indicators value changes by year
Maximum:
26.177
jan 1, 1988
At the date of observation
Value
Absolute change
Change from previous value
jan 1, 1977
5.239
+5.239
0.0%
jan 1, 1978
8.526
+3.287
62.73%
jan 1, 1979
4.195
-4.332
-50.8%
jan 1, 1980
2.872
-1.323
-31.54%
jan 1, 1981
3.723
+0.851
29.63%
jan 1, 1982
5.573
+1.85
49.69%
jan 1, 1983
8.894
+3.321
59.59%
jan 1, 1984
18.217
+9.324
104.83%
jan 1, 1985
23.218
+5.0
27.45%
jan 1, 1986
25.628
+2.41
10.38%
jan 1, 1987
24.642
-0.986
-3.85%
jan 1, 1988
26.177
+1.535
6.23%
jan 1, 1989
19.083
-7.094
-27.1%
jan 1, 1990
15.646
-3.437
-18.01%
jan 1, 1991
19.091
+3.444
22.01%
jan 1, 1992
25.66
+6.569
34.41%
jan 1, 1993
22.735
-2.925
-11.4%
jan 1, 1994
21.106
-1.629
-7.17%
jan 1, 1995
20.161
-0.944
-4.47%
jan 1, 1996
12.62
-7.541
-37.4%
jan 1, 1997
12.621
+0.001
0.01%
jan 1, 1998
7.964
-4.657
-36.9%
jan 1, 1999
11.872
+3.908
49.07%
jan 1, 2000
7.754
-4.118
-34.69%
jan 1, 2001
6.971
-0.784
-10.11%
jan 1, 2002
8.226
+1.255
18.01%
jan 1, 2003
8.83
+0.605
7.35%
jan 1, 2004
10.889
+2.059
23.31%
jan 1, 2005
11.902
+1.013
9.3%
jan 1, 2006
14.331
+2.429
20.41%
jan 1, 2007
19.822
+5.491
38.32%
jan 1, 2008
14.847
-4.976
-25.1%
jan 1, 2009
14.429
-0.418
-2.81%
jan 1, 2010
21.744
+7.315
50.7%
jan 1, 2011
16.025
-5.718
-26.3%
jan 1, 2012
16.386
+0.361
2.25%
jan 1, 2013
13.4
-2.987
-18.23%
jan 1, 2014
12.284
-1.116
-8.33%
Ranking of countries by current statistics by years


Comments: