29
/
en
AIzaSyAYiBZKx7MnpbEhh9jyipgxe19OcubqV5w
April 1, 2024
167311
Kenya
KEN
true
2
1
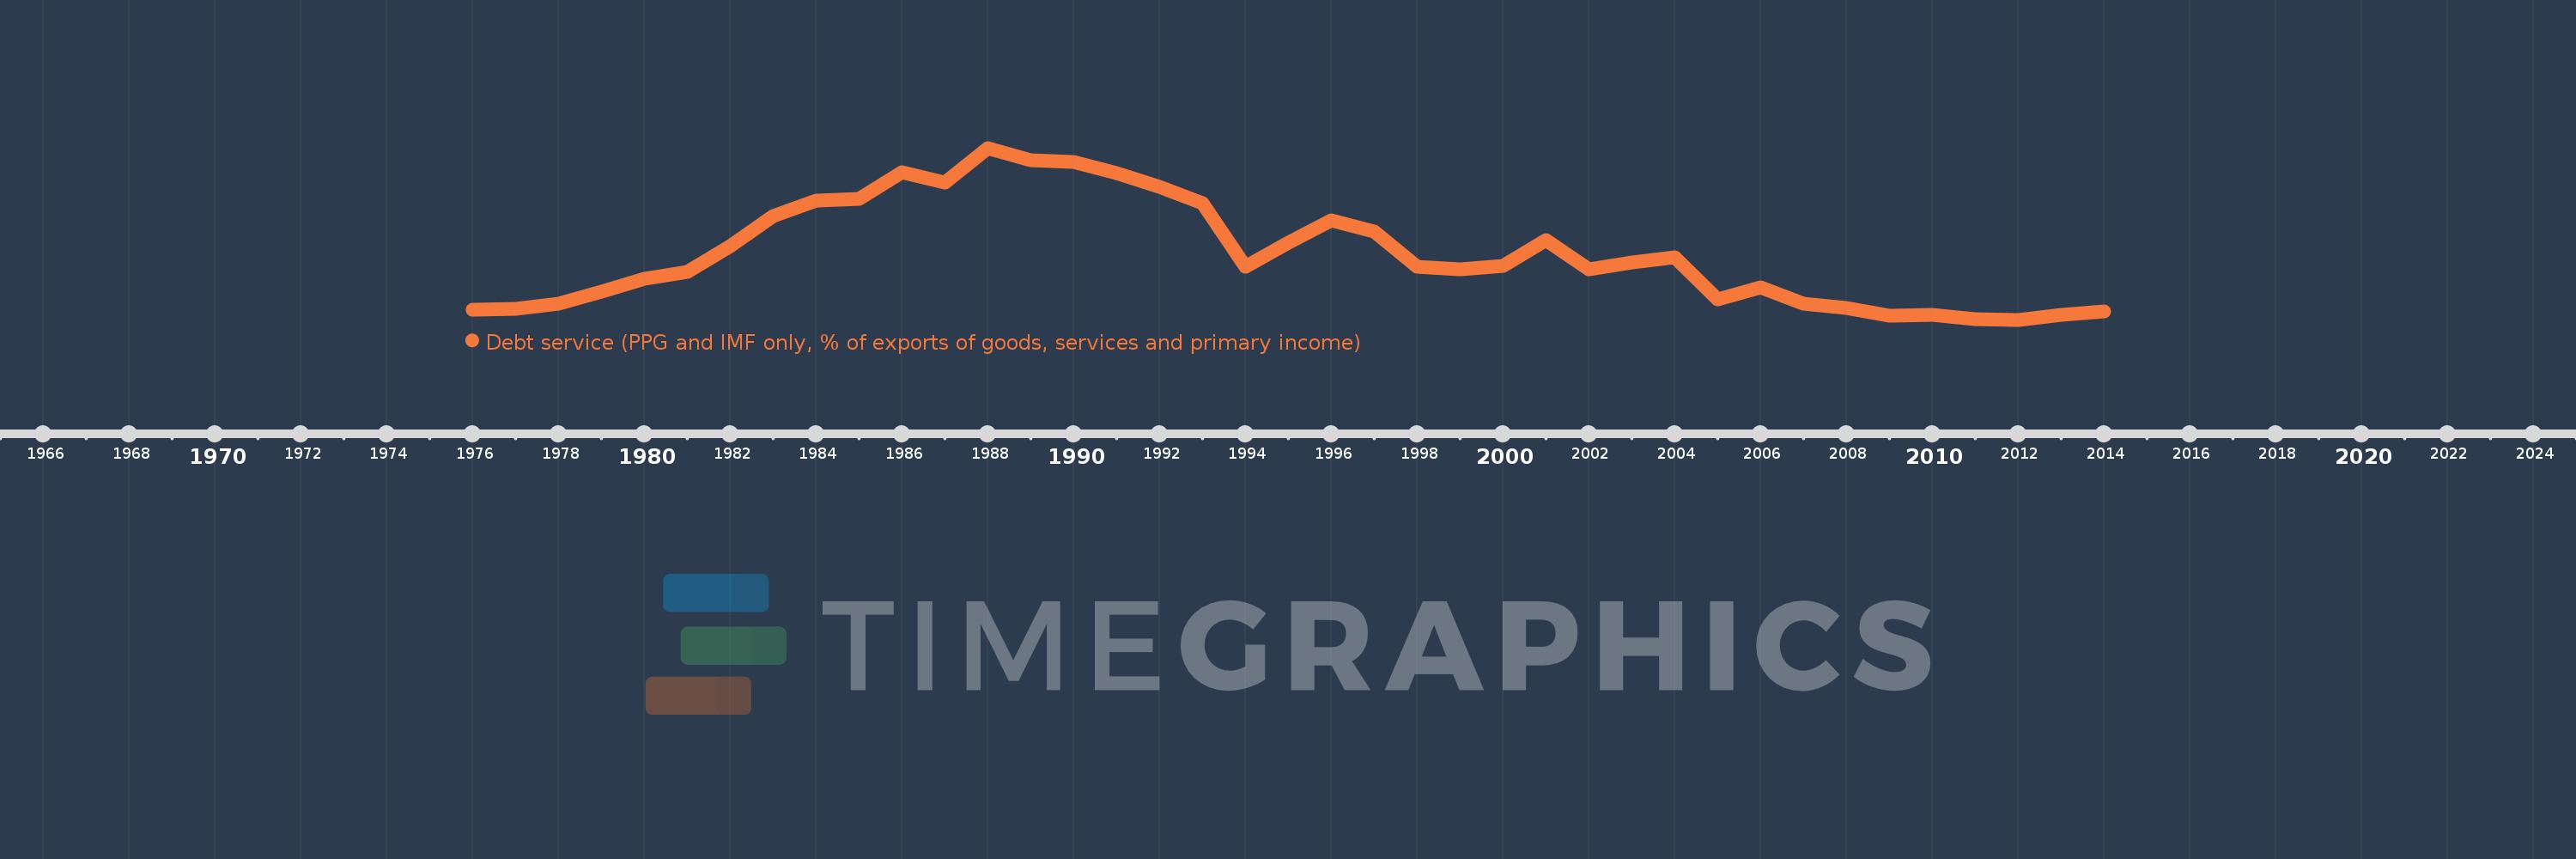
Debt service (PPG and IMF only, % of exports of goods, services and primary income)
2014,2013,2012,2011,2010,2009,2008,2007,2006,2005,2004,2003,2002,2001,2000,1999,1998,1997,1996,1995,1994,1993,1992,1991,1990,1989,1988,1987,1986,1985,1984,1983,1982,1981,1980,1979,1978,1977,1976
This statistics in other country:
Timeline:
This timeline shows a graph from 1976 to 2014 of Kenya. No data until 1975. Number of actual observations by date: 39.
Source name:
World Development Indicators
Source organization:
World Bank, International Debt Statistics.
Categories, topics:
External Debt
Last updated:
apr 23, 2017
Indicators value changes by year
Maximum:
32.823
jan 1, 1988
At the date of observation
Value
Absolute change
Change from previous value
jan 1, 1976
5.699
+5.699
0.0%
jan 1, 1977
5.86
+0.161
2.82%
jan 1, 1978
6.73
+0.87
14.85%
jan 1, 1979
8.74
+2.01
29.87%
jan 1, 1980
10.86
+2.12
24.25%
jan 1, 1981
12.059
+1.199
11.04%
jan 1, 1982
16.319
+4.26
35.33%
jan 1, 1983
21.465
+5.146
31.54%
jan 1, 1984
24.042
+2.577
12.01%
jan 1, 1985
24.315
+0.273
1.14%
jan 1, 1986
28.769
+4.454
18.32%
jan 1, 1987
27.059
-1.71
-5.94%
jan 1, 1988
32.823
+5.765
21.3%
jan 1, 1989
30.75
-2.074
-6.32%
jan 1, 1990
30.541
-0.209
-0.68%
jan 1, 1991
28.581
-1.96
-6.42%
jan 1, 1992
26.281
-2.301
-8.05%
jan 1, 1993
23.5
-2.781
-10.58%
jan 1, 1994
12.828
-10.672
-45.41%
jan 1, 1995
16.978
+4.15
32.35%
jan 1, 1996
20.727
+3.749
22.08%
jan 1, 1997
18.868
-1.859
-8.97%
jan 1, 1998
12.938
-5.93
-31.43%
jan 1, 1999
12.395
-0.543
-4.2%
jan 1, 2000
13.042
+0.647
5.22%
jan 1, 2001
17.302
+4.261
32.67%
jan 1, 2002
12.433
-4.869
-28.14%
jan 1, 2003
13.647
+1.214
9.77%
jan 1, 2004
14.459
+0.811
5.94%
jan 1, 2005
7.36
-7.099
-49.1%
jan 1, 2006
9.442
+2.082
28.29%
jan 1, 2007
6.734
-2.708
-28.68%
jan 1, 2008
5.909
-0.825
-12.25%
jan 1, 2009
4.622
-1.287
-21.78%
jan 1, 2010
4.809
+0.187
4.05%
jan 1, 2011
4.116
-0.694
-14.42%
jan 1, 2012
4.0
-0.116
-2.81%
jan 1, 2013
4.788
+0.788
19.71%
jan 1, 2014
5.397
+0.608
12.7%
Ranking of countries by current statistics by years


Comments: