29
/
en
AIzaSyAYiBZKx7MnpbEhh9jyipgxe19OcubqV5w
April 1, 2024
201408
Morocco
MAR
true
2
1
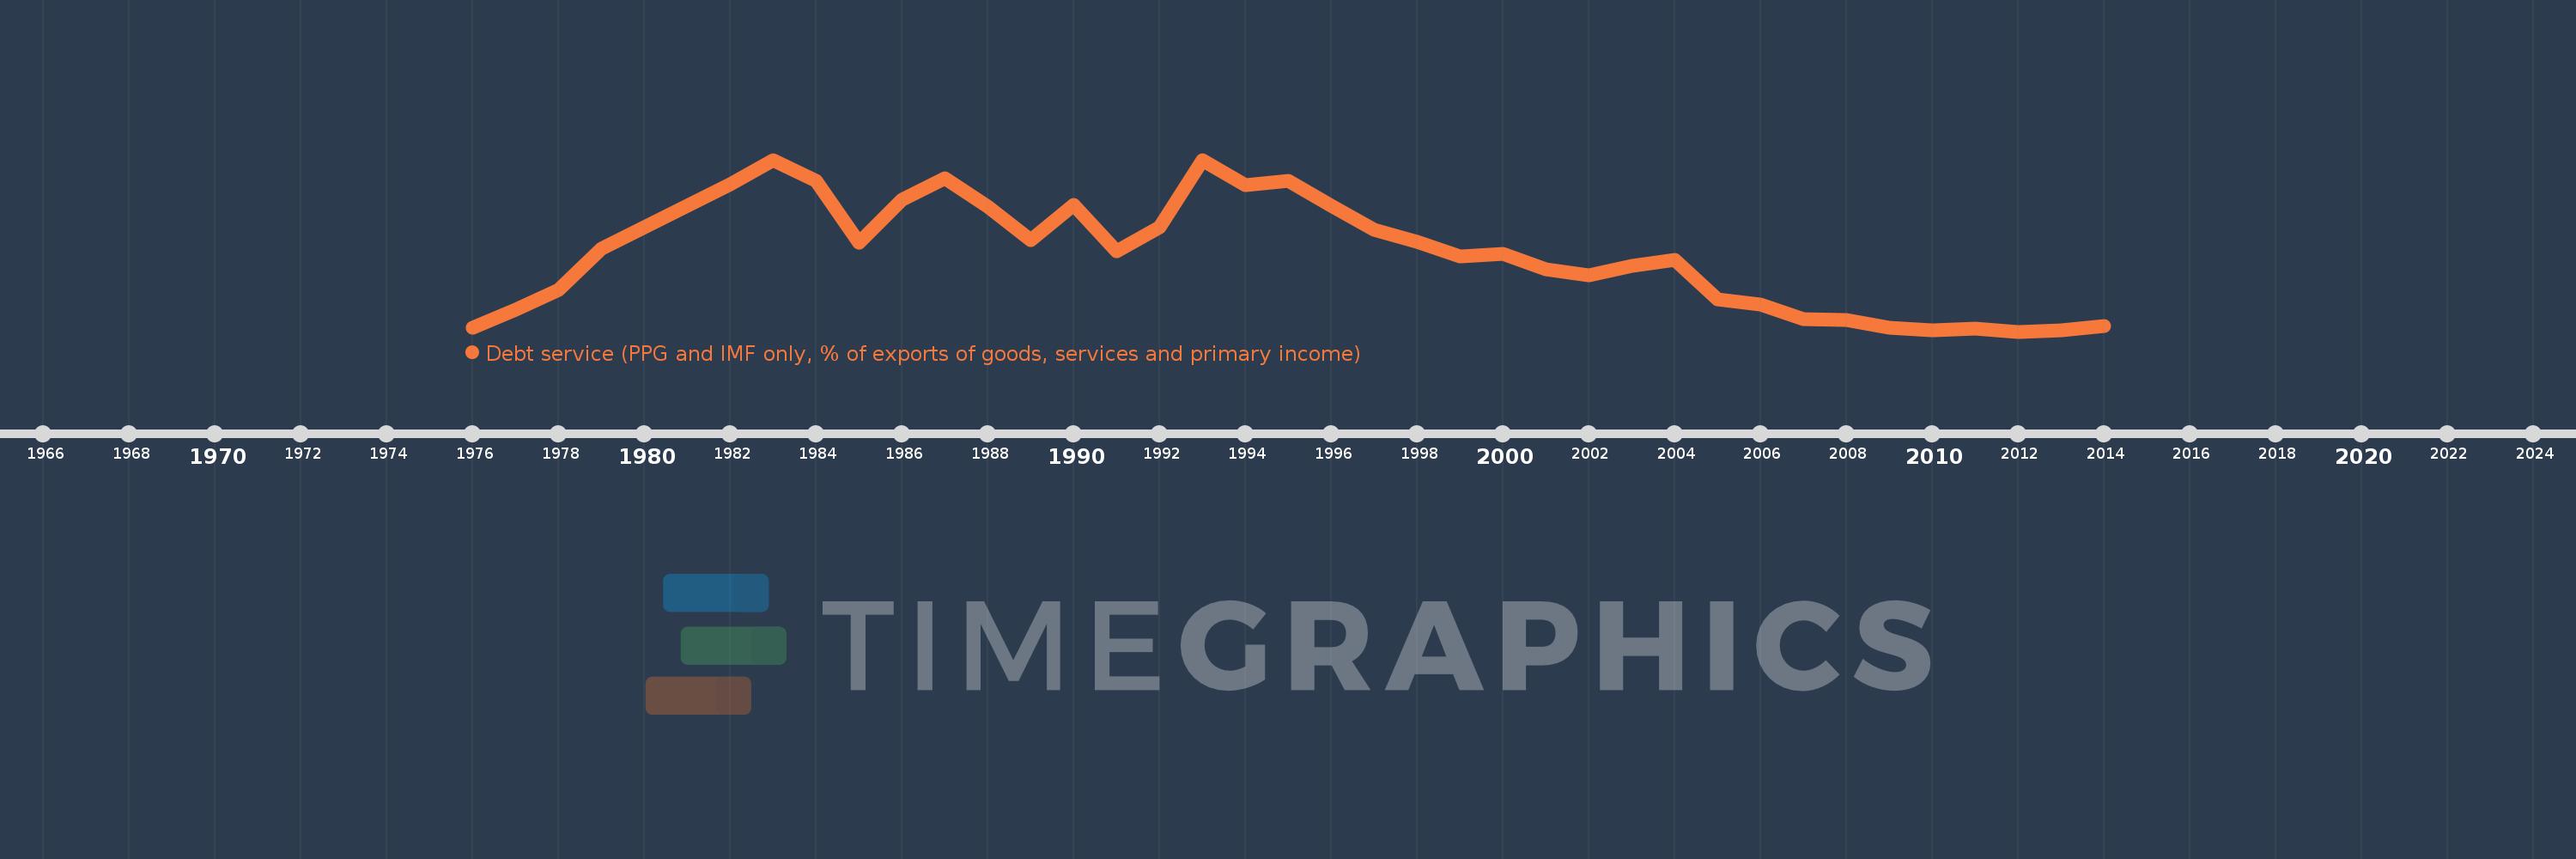
Debt service (PPG and IMF only, % of exports of goods, services and primary income)
2014,2013,2012,2011,2010,2009,2008,2007,2006,2005,2004,2003,2002,2001,2000,1999,1998,1997,1996,1995,1994,1993,1992,1991,1990,1989,1988,1987,1986,1985,1984,1983,1982,1981,1980,1979,1978,1977,1976
This statistics in other country:
Timeline:
This timeline shows a graph from 1976 to 2014 of Morocco. No data until 1975. Number of actual observations by date: 39.
Source name:
World Development Indicators
Source organization:
World Bank, International Debt Statistics.
Categories, topics:
External Debt
Last updated:
apr 23, 2017
Indicators value changes by year
Maximum:
52.085
jan 1, 1983
At the date of observation
Value
Absolute change
Change from previous value
jan 1, 1976
7.835
+7.835
0.0%
jan 1, 1977
12.445
+4.61
58.84%
jan 1, 1978
17.66
+5.215
41.91%
jan 1, 1979
28.702
+11.041
62.52%
jan 1, 1980
34.343
+5.641
19.65%
jan 1, 1981
39.888
+5.546
16.15%
jan 1, 1982
45.738
+5.849
14.66%
jan 1, 1983
52.085
+6.347
13.88%
jan 1, 1984
46.627
-5.457
-10.48%
jan 1, 1985
30.27
-16.357
-35.08%
jan 1, 1986
41.439
+11.169
36.9%
jan 1, 1987
47.236
+5.797
13.99%
jan 1, 1988
39.754
-7.483
-15.84%
jan 1, 1989
30.779
-8.974
-22.57%
jan 1, 1990
40.221
+9.442
30.68%
jan 1, 1991
27.891
-12.33
-30.66%
jan 1, 1992
34.197
+6.307
22.61%
jan 1, 1993
52.069
+17.872
52.26%
jan 1, 1994
45.389
-6.681
-12.83%
jan 1, 1995
46.524
+1.136
2.5%
jan 1, 1996
39.86
-6.664
-14.32%
jan 1, 1997
33.644
-6.217
-15.6%
jan 1, 1998
30.464
-3.179
-9.45%
jan 1, 1999
26.559
-3.906
-12.82%
jan 1, 2000
27.363
+0.805
3.03%
jan 1, 2001
23.075
-4.288
-15.67%
jan 1, 2002
21.688
-1.388
-6.01%
jan 1, 2003
24.036
+2.348
10.83%
jan 1, 2004
25.748
+1.712
7.12%
jan 1, 2005
15.197
-10.551
-40.98%
jan 1, 2006
13.805
-1.392
-9.16%
jan 1, 2007
10.097
-3.708
-26.86%
jan 1, 2008
9.72
-0.377
-3.73%
jan 1, 2009
7.756
-1.965
-20.21%
jan 1, 2010
7.028
-0.728
-9.38%
jan 1, 2011
7.508
+0.48
6.82%
jan 1, 2012
6.753
-0.754
-10.05%
jan 1, 2013
7.046
+0.293
4.33%
jan 1, 2014
8.248
+1.202
17.06%
Ranking of countries by current statistics by years


Comments: