29
/
en
AIzaSyAYiBZKx7MnpbEhh9jyipgxe19OcubqV5w
April 1, 2024
121951
Dominican Republic
DOM
true
2
1
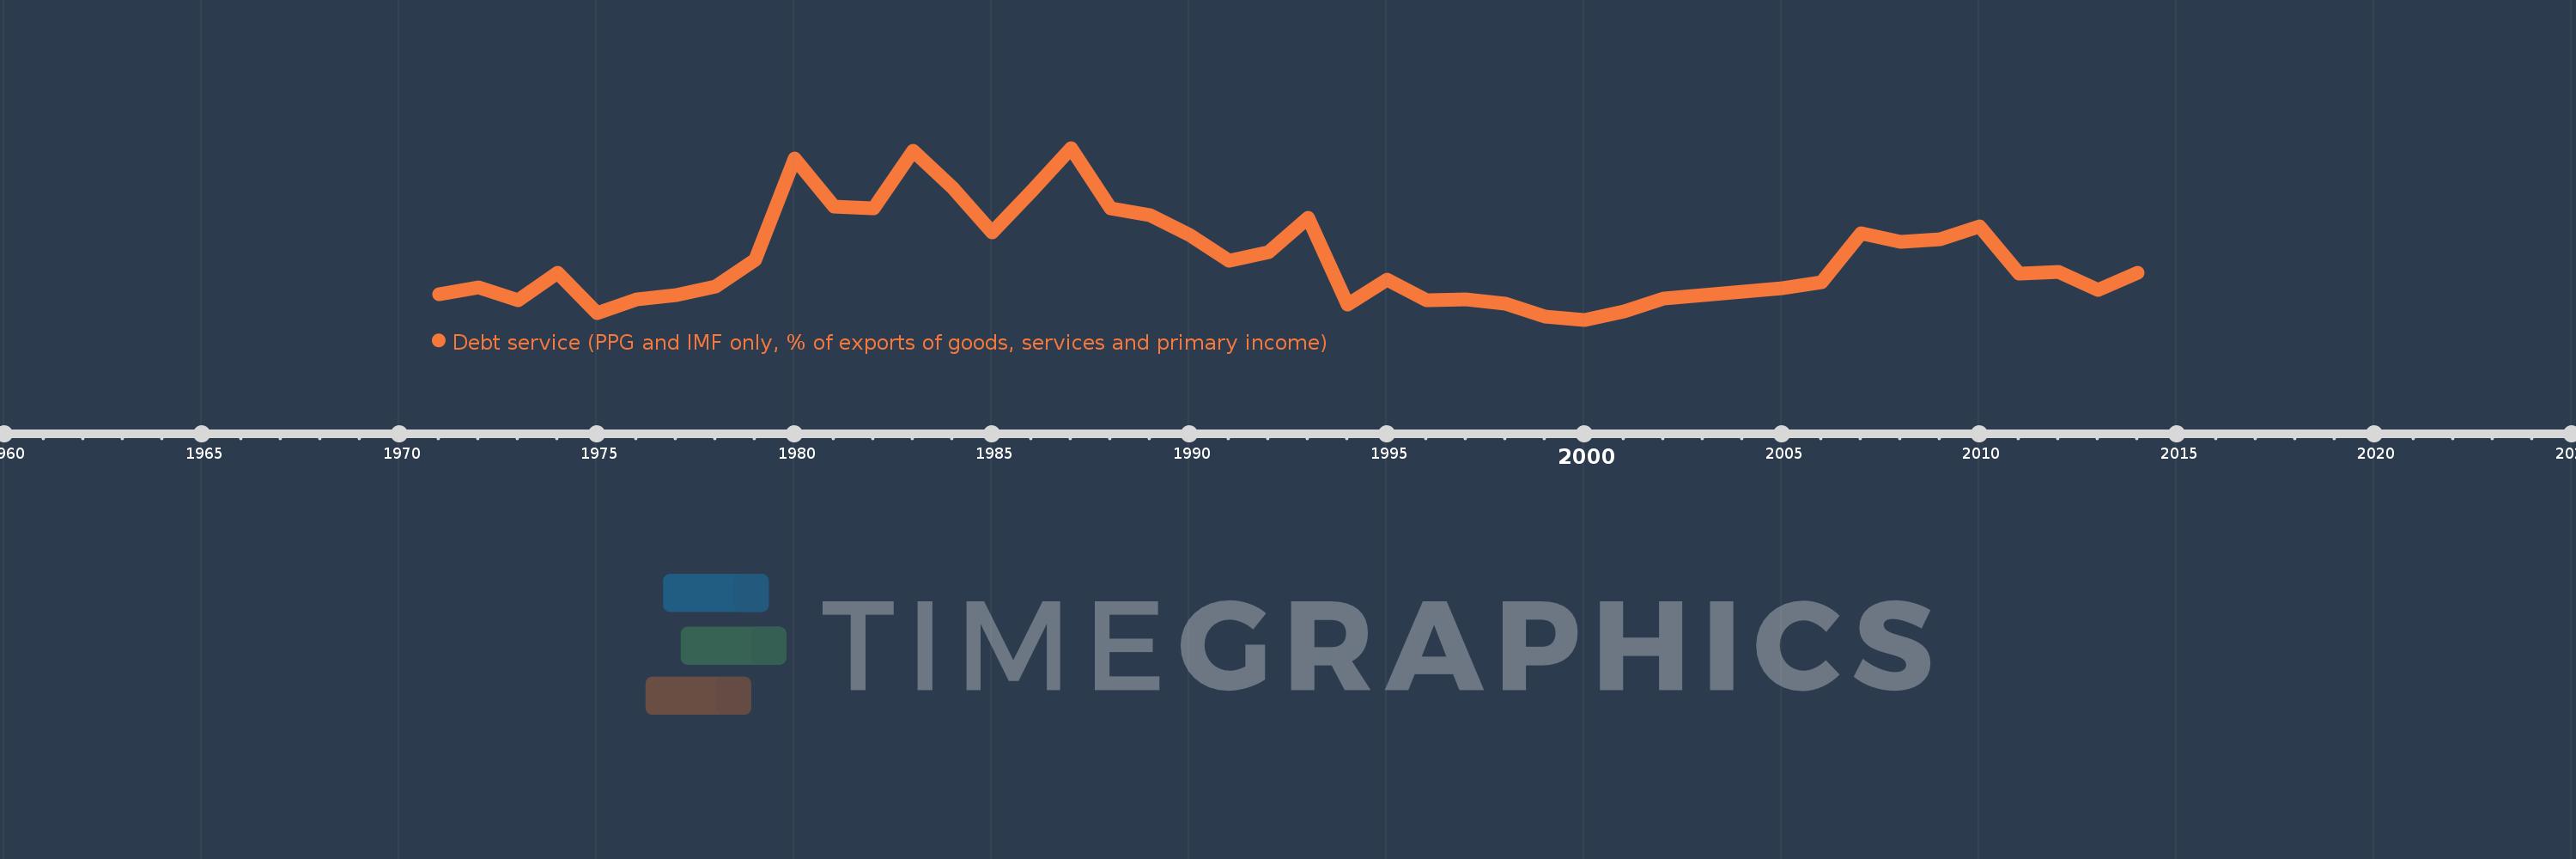
Debt service (PPG and IMF only, % of exports of goods, services and primary income)
2014,2013,2012,2011,2010,2009,2008,2007,2006,2005,2004,2003,2002,2001,2000,1999,1998,1997,1996,1995,1994,1993,1992,1991,1990,1989,1988,1987,1986,1985,1984,1983,1982,1981,1980,1979,1978,1977,1976,1975,1974,1973,1972,1971
This statistics in other country:
Timeline:
This timeline shows a graph from 1971 to 2014 of Dominican Republic. No data until 1970. Number of actual observations by date: 44.
Source name:
World Development Indicators
Source organization:
World Bank, International Debt Statistics.
Categories, topics:
External Debt
Last updated:
apr 23, 2017
Indicators value changes by year
Maximum:
24.197
jan 1, 1987
At the date of observation
Value
Absolute change
Change from previous value
jan 1, 1971
7.142
+7.142
0.0%
jan 1, 1972
8.002
+0.86
12.05%
jan 1, 1973
6.454
-1.548
-19.35%
jan 1, 1974
9.645
+3.191
49.44%
jan 1, 1975
4.988
-4.657
-48.28%
jan 1, 1976
6.507
+1.519
30.46%
jan 1, 1977
7.03
+0.523
8.04%
jan 1, 1978
8.021
+0.991
14.09%
jan 1, 1979
11.17
+3.149
39.26%
jan 1, 1980
22.972
+11.802
105.65%
jan 1, 1981
17.353
-5.619
-24.46%
jan 1, 1982
17.144
-0.209
-1.2%
jan 1, 1983
23.912
+6.768
39.47%
jan 1, 1984
19.608
-4.304
-18.0%
jan 1, 1985
14.331
-5.276
-26.91%
jan 1, 1986
19.169
+4.837
33.75%
jan 1, 1987
24.197
+5.029
26.23%
jan 1, 1988
17.174
-7.024
-29.03%
jan 1, 1989
16.367
-0.807
-4.7%
jan 1, 1990
14.091
-2.276
-13.91%
jan 1, 1991
11.061
-3.03
-21.5%
jan 1, 1992
12.064
+1.003
9.07%
jan 1, 1993
16.039
+3.974
32.94%
jan 1, 1994
5.994
-10.045
-62.63%
jan 1, 1995
8.9
+2.906
48.48%
jan 1, 1996
6.46
-2.439
-27.41%
jan 1, 1997
6.511
+0.051
0.78%
jan 1, 1998
6.014
-0.497
-7.63%
jan 1, 1999
4.561
-1.453
-24.17%
jan 1, 2000
4.184
-0.377
-8.27%
jan 1, 2001
5.176
+0.992
23.72%
jan 1, 2002
6.699
+1.523
29.43%
jan 1, 2003
7.023
+0.324
4.83%
jan 1, 2004
7.44
+0.417
5.94%
jan 1, 2005
7.819
+0.378
5.08%
jan 1, 2006
8.54
+0.721
9.23%
jan 1, 2007
14.211
+5.671
66.41%
jan 1, 2008
13.212
-1.0
-7.03%
jan 1, 2009
13.514
+0.302
2.29%
jan 1, 2010
15.107
+1.593
11.79%
jan 1, 2011
9.553
-5.554
-36.77%
jan 1, 2012
9.777
+0.225
2.35%
jan 1, 2013
7.628
-2.149
-21.98%
jan 1, 2014
9.635
+2.007
26.31%
Ranking of countries by current statistics by years


Comments: