29
/
en
AIzaSyAYiBZKx7MnpbEhh9jyipgxe19OcubqV5w
April 1, 2024
146720
Guinea-Bissau
GNB
true
2
1
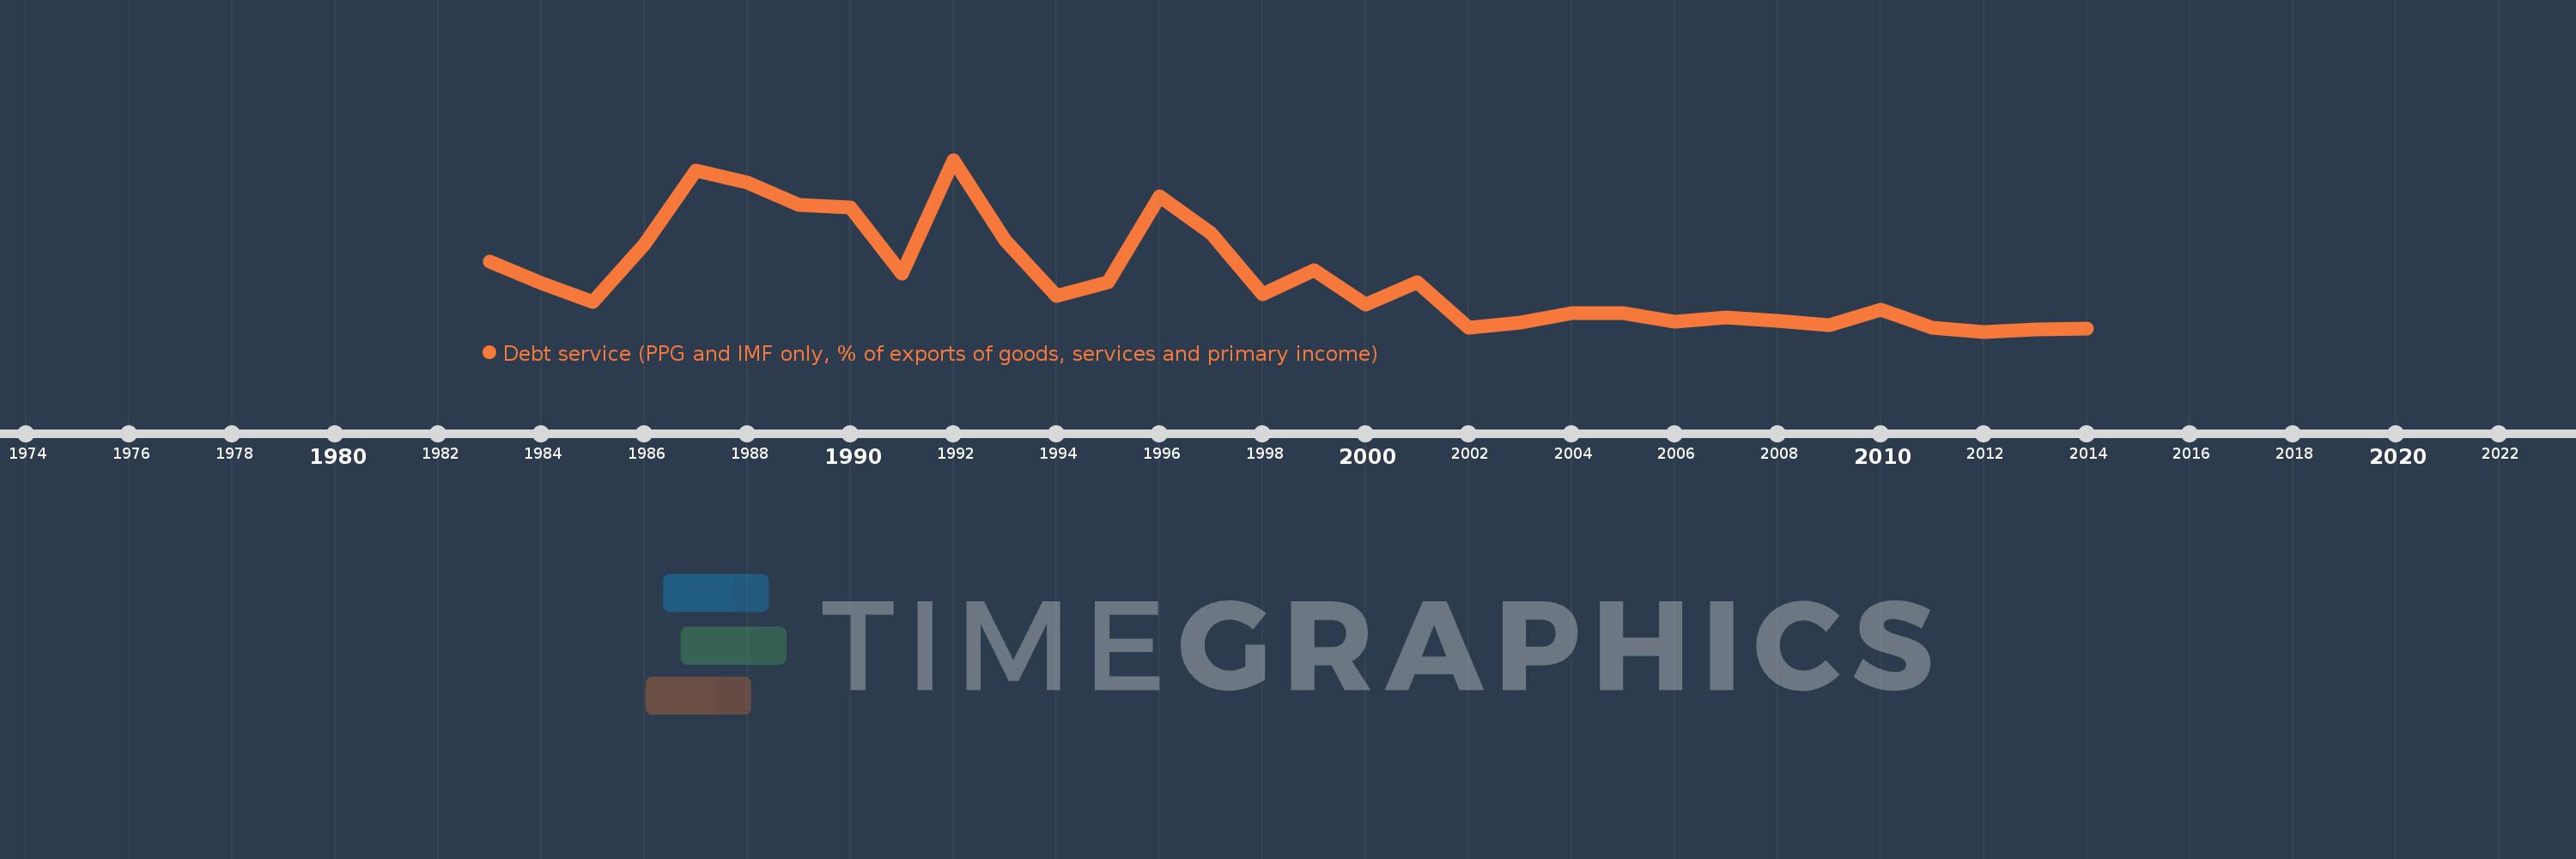
Debt service (PPG and IMF only, % of exports of goods, services and primary income)
2014,2013,2012,2011,2010,2009,2008,2007,2006,2005,2004,2003,2002,2001,2000,1999,1998,1997,1996,1995,1994,1993,1992,1991,1990,1989,1988,1987,1986,1985,1984,1983
This statistics in other country:
Timeline:
This timeline shows a graph from 1983 to 2014 of Guinea-Bissau. No data until 1982. Number of actual observations by date: 32.
Source name:
World Development Indicators
Source organization:
World Bank, International Debt Statistics.
Categories, topics:
External Debt
Last updated:
apr 23, 2017
Indicators value changes by year
Maximum:
64.693
jan 1, 1992
At the date of observation
Value
Absolute change
Change from previous value
jan 1, 1983
26.862
+26.862
0.0%
jan 1, 1984
18.902
-7.96
-29.63%
jan 1, 1985
11.843
-7.059
-37.35%
jan 1, 1986
33.182
+21.34
180.2%
jan 1, 1987
60.701
+27.519
82.93%
jan 1, 1988
56.143
-4.558
-7.51%
jan 1, 1989
47.818
-8.325
-14.83%
jan 1, 1990
46.962
-0.855
-1.79%
jan 1, 1991
22.115
-24.847
-52.91%
jan 1, 1992
64.693
+42.578
192.53%
jan 1, 1993
34.692
-30.0
-46.37%
jan 1, 1994
13.95
-20.742
-59.79%
jan 1, 1995
19.142
+5.192
37.22%
jan 1, 1996
51.095
+31.953
166.92%
jan 1, 1997
37.28
-13.815
-27.04%
jan 1, 1998
14.462
-22.819
-61.21%
jan 1, 1999
23.49
+9.028
62.43%
jan 1, 2000
10.714
-12.776
-54.39%
jan 1, 2001
19.135
+8.421
78.59%
jan 1, 2002
2.039
-17.096
-89.35%
jan 1, 2003
4.112
+2.073
101.71%
jan 1, 2004
7.557
+3.446
83.79%
jan 1, 2005
7.475
-0.083
-1.09%
jan 1, 2006
4.216
-3.259
-43.59%
jan 1, 2007
5.964
+1.748
41.44%
jan 1, 2008
4.677
-1.287
-21.58%
jan 1, 2009
3.048
-1.629
-34.82%
jan 1, 2010
8.71
+5.662
185.75%
jan 1, 2011
2.092
-6.618
-75.98%
jan 1, 2012
0.653
-1.439
-68.77%
jan 1, 2013
1.332
+0.679
103.9%
jan 1, 2014
1.85
+0.517
38.83%
Ranking of countries by current statistics by years


Comments: