29
/
en
AIzaSyAYiBZKx7MnpbEhh9jyipgxe19OcubqV5w
April 1, 2024
185028
Madagascar
MDG
true
2
1
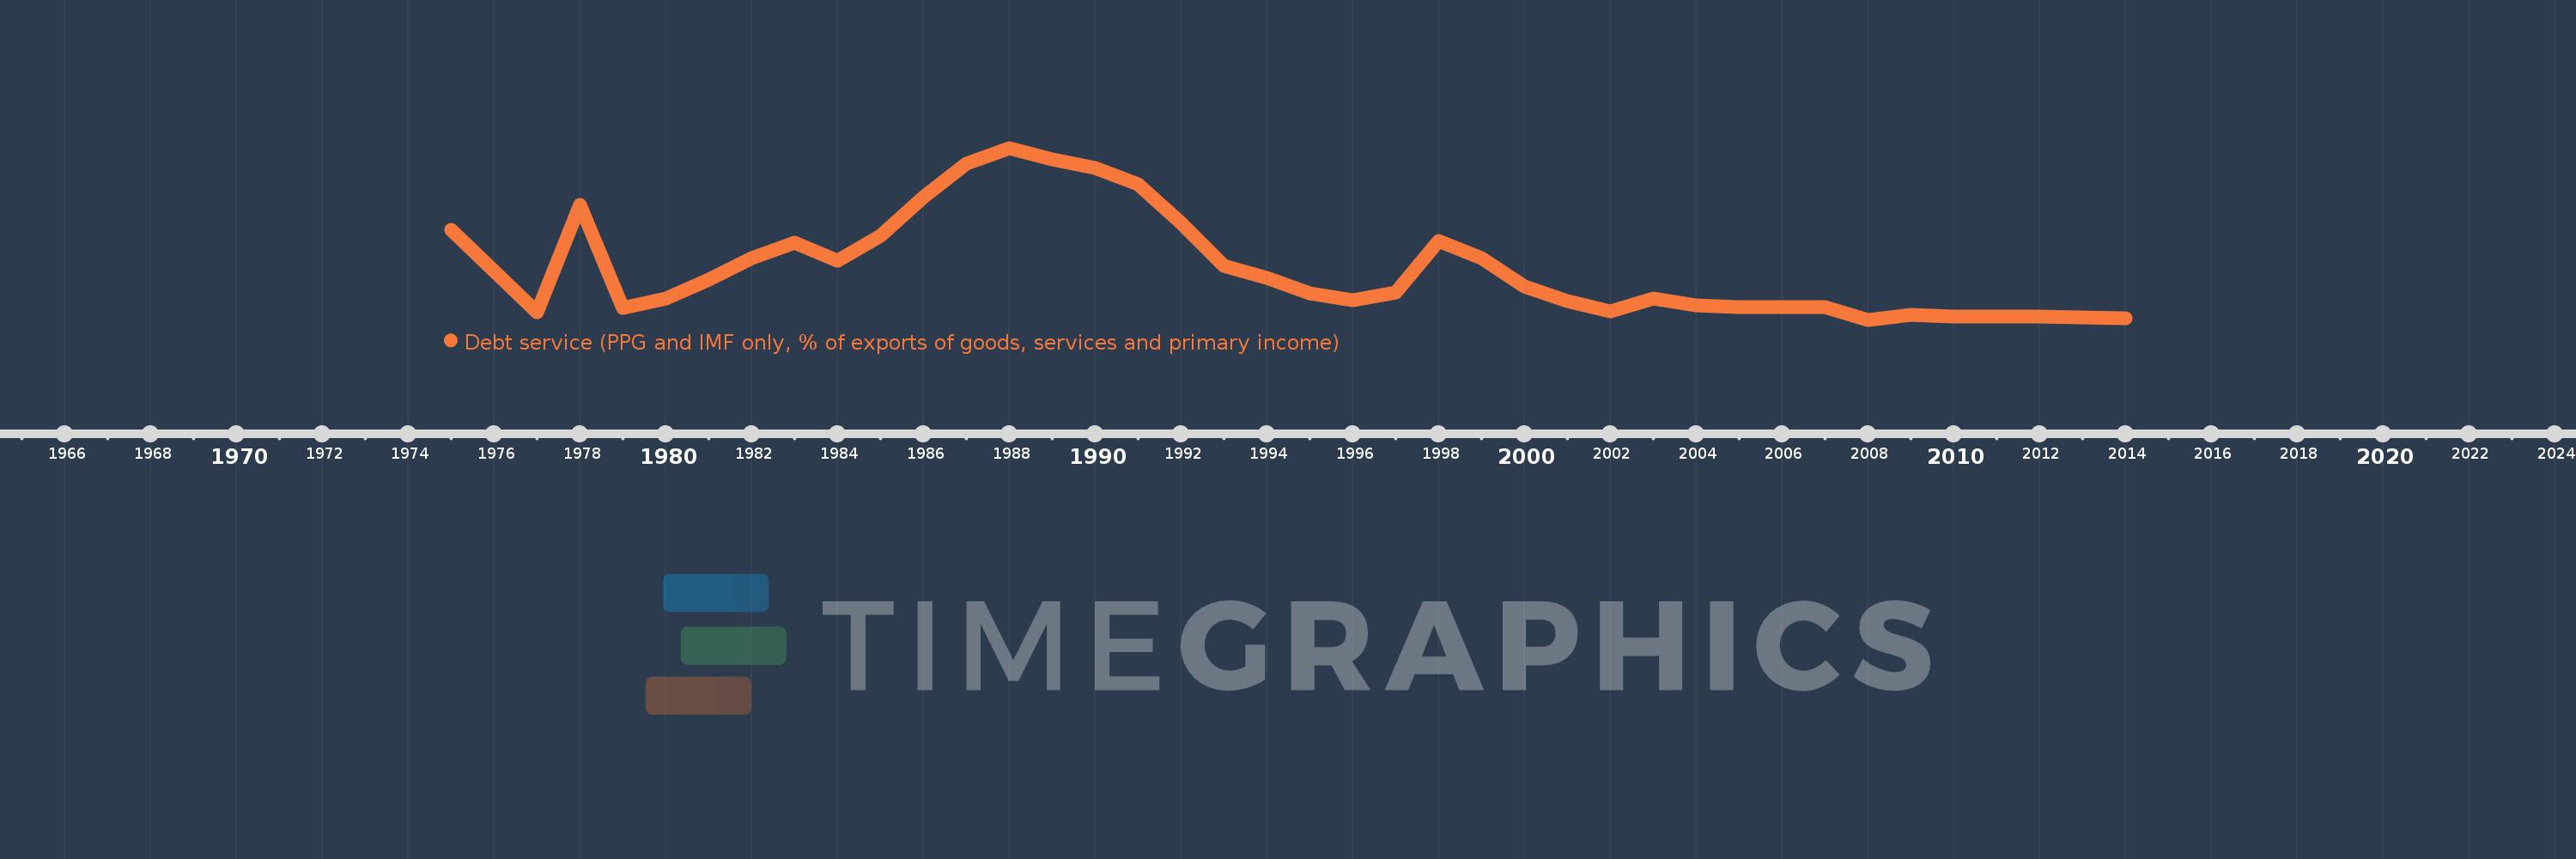
Debt service (PPG and IMF only, % of exports of goods, services and primary income)
2014,2013,2012,2011,2010,2009,2008,2007,2006,2005,2004,2003,2002,2001,2000,1999,1998,1997,1996,1995,1994,1993,1992,1991,1990,1989,1988,1987,1986,1985,1984,1983,1982,1981,1980,1979,1978,1977,1976,1975
This statistics in other country:
Timeline:
This timeline shows a graph from 1975 to 2014 of Madagascar. No data until 1974. Number of actual observations by date: 40.
Source name:
World Development Indicators
Source organization:
World Bank, International Debt Statistics.
Categories, topics:
External Debt
Last updated:
apr 23, 2017
Indicators value changes by year
Maximum:
55.909
jan 1, 1988
At the date of observation
Value
Absolute change
Change from previous value
jan 1, 1975
29.877
+29.877
0.0%
jan 1, 1976
16.587
-13.291
-44.48%
jan 1, 1977
3.29
-13.297
-80.17%
jan 1, 1978
37.753
+34.463
1.05K%
jan 1, 1979
4.802
-32.95
-87.28%
jan 1, 1980
7.863
+3.061
63.74%
jan 1, 1981
13.86
+5.997
76.27%
jan 1, 1982
20.67
+6.81
49.13%
jan 1, 1983
25.697
+5.027
24.32%
jan 1, 1984
19.883
-5.814
-22.62%
jan 1, 1985
27.952
+8.068
40.58%
jan 1, 1986
40.231
+12.279
43.93%
jan 1, 1987
50.847
+10.616
26.39%
jan 1, 1988
55.909
+5.062
9.95%
jan 1, 1989
52.153
-3.756
-6.72%
jan 1, 1990
49.43
-2.724
-5.22%
jan 1, 1991
44.356
-5.074
-10.26%
jan 1, 1992
31.821
-12.535
-28.26%
jan 1, 1993
18.111
-13.709
-43.08%
jan 1, 1994
14.357
-3.754
-20.73%
jan 1, 1995
9.552
-4.805
-33.47%
jan 1, 1996
7.263
-2.289
-23.96%
jan 1, 1997
9.771
+2.508
34.53%
jan 1, 1998
26.141
+16.37
167.53%
jan 1, 1999
20.64
-5.501
-21.04%
jan 1, 2000
11.657
-8.983
-43.52%
jan 1, 2001
7.075
-4.583
-39.31%
jan 1, 2002
3.548
-3.527
-49.85%
jan 1, 2003
7.685
+4.137
116.59%
jan 1, 2004
5.617
-2.068
-26.91%
jan 1, 2005
5.005
-0.612
-10.89%
jan 1, 2006
5.087
+0.082
1.64%
jan 1, 2007
4.96
-0.127
-2.5%
jan 1, 2008
0.998
-3.962
-79.87%
jan 1, 2009
2.528
+1.529
153.2%
jan 1, 2010
2.088
-0.44
-17.39%
jan 1, 2011
1.949
-0.139
-6.66%
jan 1, 2012
1.977
+0.028
1.44%
jan 1, 2013
1.802
-0.175
-8.86%
jan 1, 2014
1.548
-0.253
-14.07%
Ranking of countries by current statistics by years


Comments: