29
/
en
AIzaSyAYiBZKx7MnpbEhh9jyipgxe19OcubqV5w
April 1, 2024
44961
Low & middle income
LMY
false
2
1
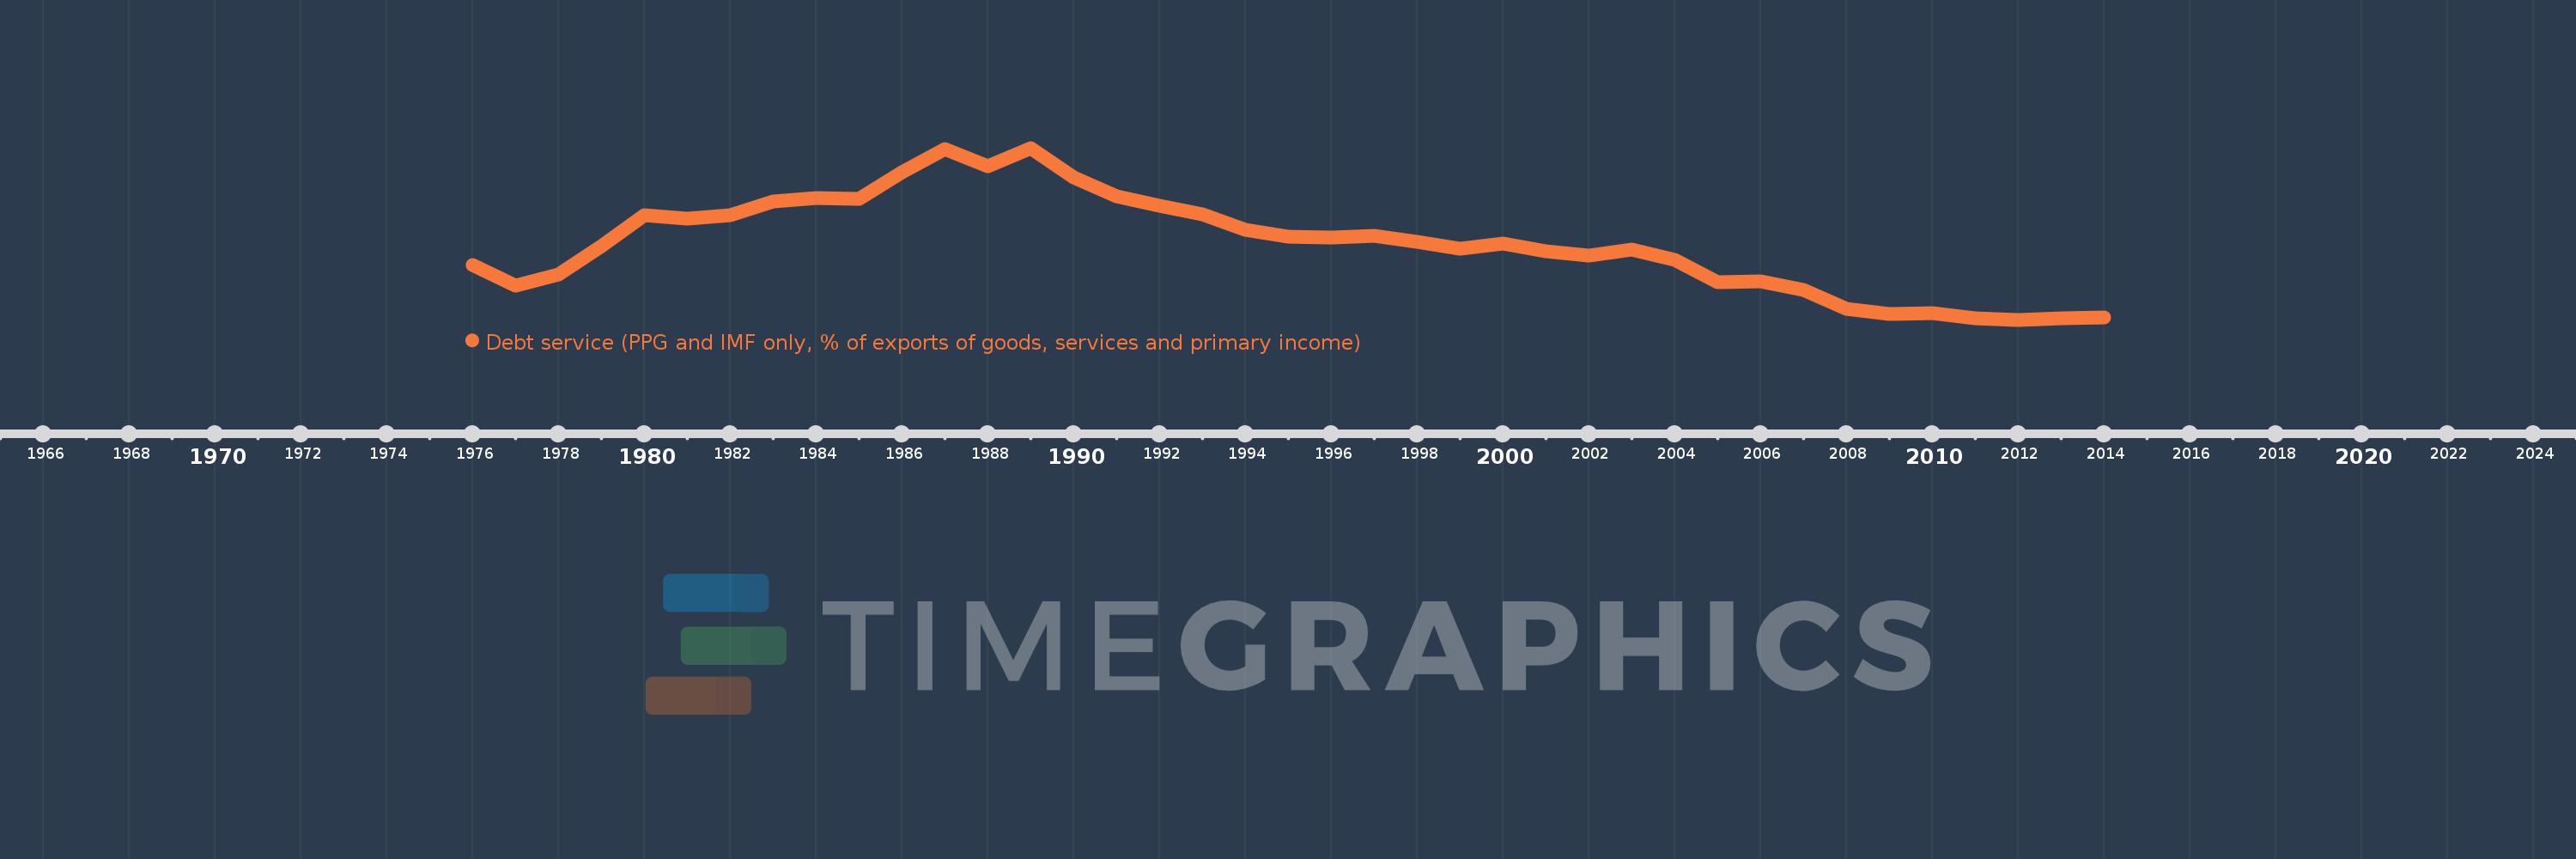
Debt service (PPG and IMF only, % of exports of goods, services and primary income)
2014,2013,2012,2011,2010,2009,2008,2007,2006,2005,2004,2003,2002,2001,2000,1999,1998,1997,1996,1995,1994,1993,1992,1991,1990,1989,1988,1987,1986,1985,1984,1983,1982,1981,1980,1979,1978,1977,1976
This statistics in other country:
Timeline:
This timeline shows a graph from 1976 to 2014 of Low & middle income. No data until 1975. Number of actual observations by date: 39.
Source name:
World Development Indicators
Source organization:
World Bank, International Debt Statistics.
Categories, topics:
External Debt
Last updated:
apr 23, 2017
Indicators value changes by year
Maximum:
25.183
jan 1, 1989
At the date of observation
Value
Absolute change
Change from previous value
jan 1, 1976
9.864
+9.864
0.0%
jan 1, 1977
7.2
-2.664
-27.0%
jan 1, 1978
8.674
+1.473
20.46%
jan 1, 1979
12.34
+3.666
42.27%
jan 1, 1980
16.412
+4.072
32.99%
jan 1, 1981
15.903
-0.509
-3.1%
jan 1, 1982
16.393
+0.491
3.08%
jan 1, 1983
18.23
+1.837
11.2%
jan 1, 1984
18.636
+0.407
2.23%
jan 1, 1985
18.508
-0.128
-0.69%
jan 1, 1986
22.023
+3.515
18.99%
jan 1, 1987
25.025
+3.002
13.63%
jan 1, 1988
22.749
-2.276
-9.09%
jan 1, 1989
25.183
+2.434
10.7%
jan 1, 1990
21.378
-3.805
-15.11%
jan 1, 1991
18.897
-2.481
-11.6%
jan 1, 1992
17.629
-1.268
-6.71%
jan 1, 1993
16.469
-1.16
-6.58%
jan 1, 1994
14.445
-2.024
-12.29%
jan 1, 1995
13.551
-0.894
-6.19%
jan 1, 1996
13.439
-0.112
-0.83%
jan 1, 1997
13.664
+0.226
1.68%
jan 1, 1998
12.855
-0.81
-5.93%
jan 1, 1999
12.028
-0.826
-6.43%
jan 1, 2000
12.634
+0.606
5.04%
jan 1, 2001
11.629
-1.005
-7.95%
jan 1, 2002
11.105
-0.525
-4.51%
jan 1, 2003
11.902
+0.797
7.18%
jan 1, 2004
10.507
-1.395
-11.72%
jan 1, 2005
7.608
-2.899
-27.59%
jan 1, 2006
7.702
+0.094
1.24%
jan 1, 2007
6.592
-1.11
-14.41%
jan 1, 2008
4.096
-2.497
-37.87%
jan 1, 2009
3.434
-0.661
-16.14%
jan 1, 2010
3.589
+0.155
4.51%
jan 1, 2011
2.897
-0.693
-19.3%
jan 1, 2012
2.715
-0.182
-6.27%
jan 1, 2013
2.861
+0.146
5.39%
jan 1, 2014
3.012
+0.151
5.27%
Ranking of countries by current statistics by years


Comments: