29
/
en
AIzaSyAYiBZKx7MnpbEhh9jyipgxe19OcubqV5w
April 1, 2024
49910
Middle East & North Africa (IDA & IBRD countries)
TMN
false
2
1
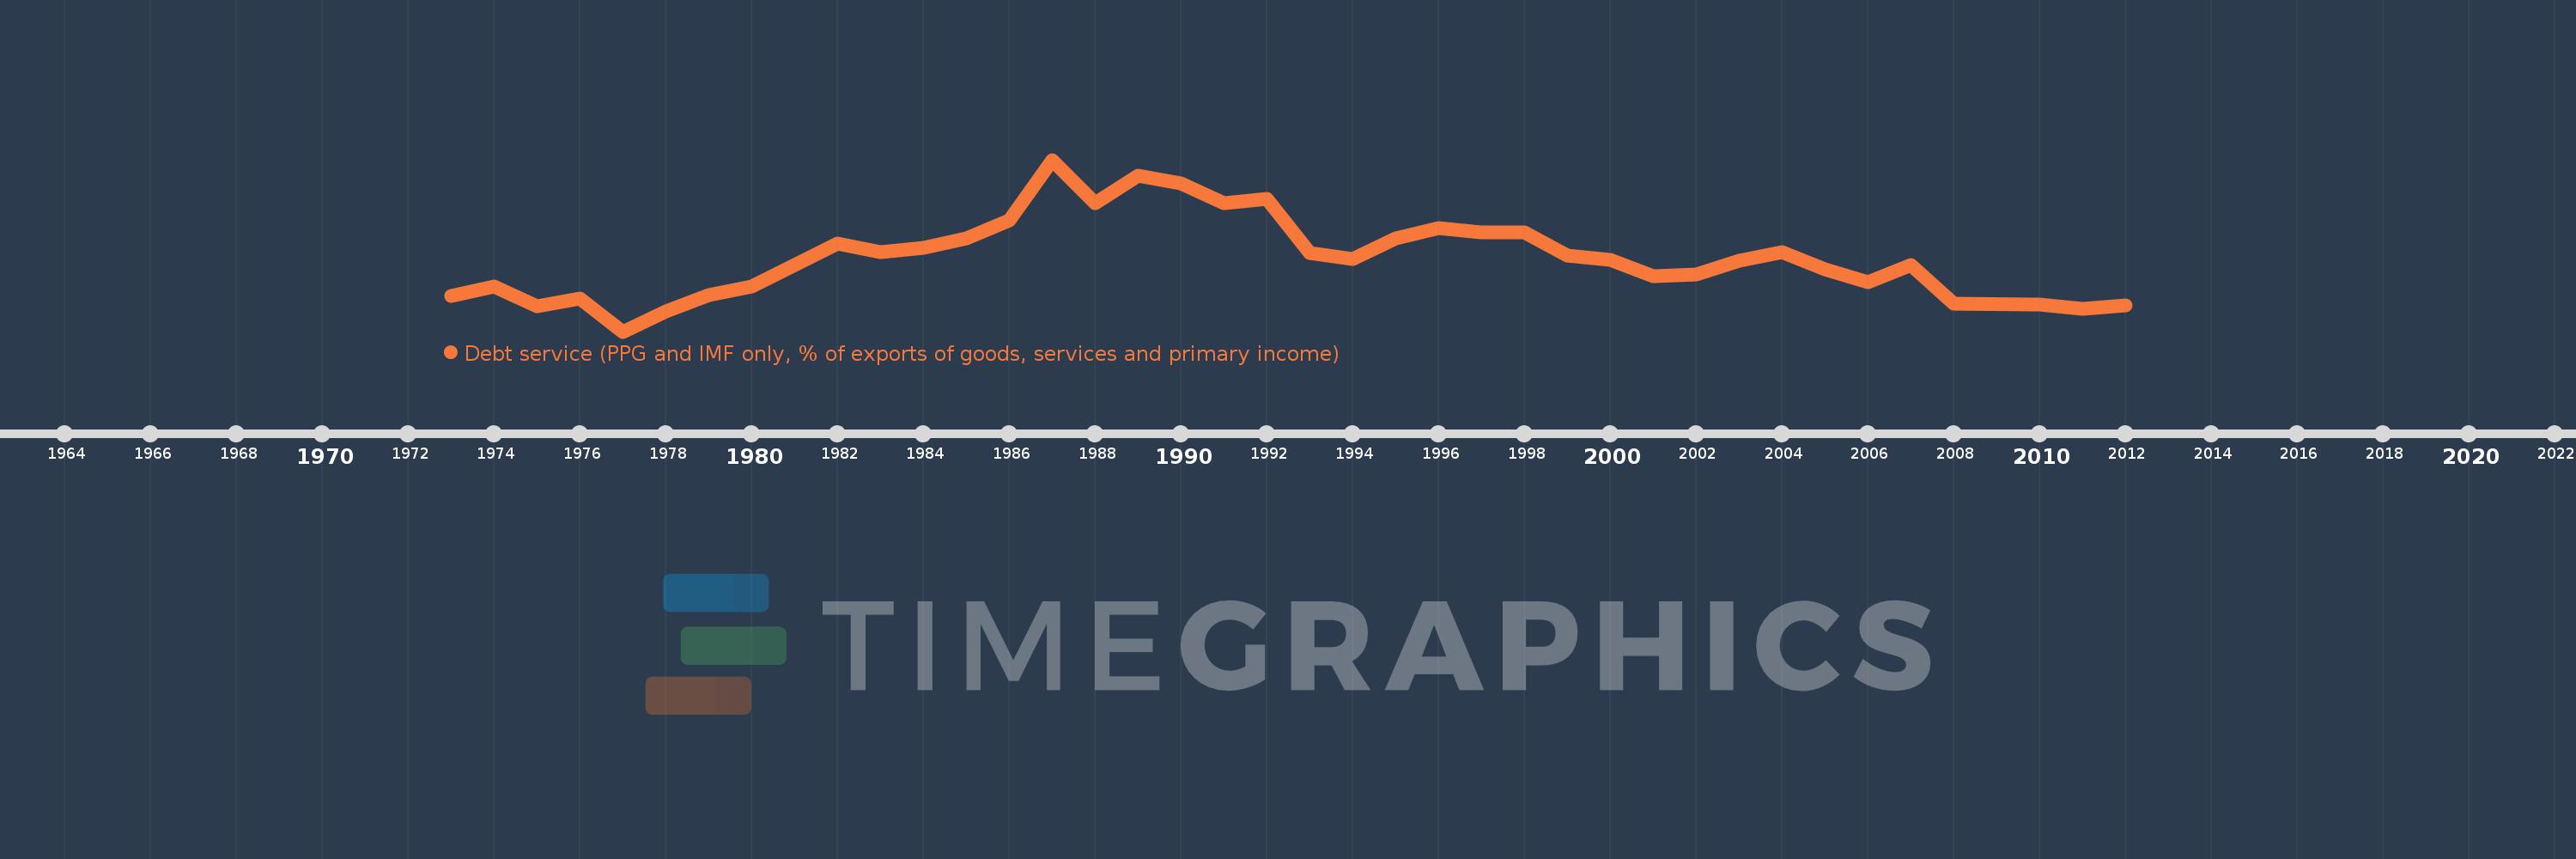
Debt service (PPG and IMF only, % of exports of goods, services and primary income)
2012,2011,2010,2008,2007,2006,2005,2004,2003,2002,2001,2000,1999,1998,1997,1996,1995,1994,1993,1992,1991,1990,1989,1988,1987,1986,1985,1984,1983,1982,1980,1979,1978,1977,1976,1975,1974,1973
This statistics in other country:
Timeline:
This timeline shows a graph from 1973 to 2012 of Middle East & North Africa (IDA & IBRD countries). No data until 1972. Number of actual observations by date: 38.
Source name:
World Development Indicators
Source organization:
World Bank, International Debt Statistics.
Categories, topics:
External Debt
Last updated:
apr 23, 2017
Indicators value changes by year
At the date of observation
Value
Absolute change
Change from previous value
jan 1, 1973
7.926
+7.926
0.0%
jan 1, 1974
9.78
+1.854
23.4%
jan 1, 1975
5.944
-3.837
-39.23%
jan 1, 1976
7.374
+1.43
24.05%
jan 1, 1977
1.089
-6.285
-85.24%
jan 1, 1978
4.914
+3.826
351.46%
jan 1, 1979
8.128
+3.213
65.39%
jan 1, 1980
9.745
+1.617
19.89%
jan 1, 1982
17.996
+8.251
84.67%
jan 1, 1983
16.428
-1.568
-8.71%
jan 1, 1984
17.223
+0.794
4.84%
jan 1, 1985
19.075
+1.852
10.76%
jan 1, 1986
22.49
+3.415
17.9%
jan 1, 1987
34.14
+11.65
51.8%
jan 1, 1988
25.87
-8.269
-24.22%
jan 1, 1989
31.025
+5.155
19.93%
jan 1, 1990
29.527
-1.499
-4.83%
jan 1, 1991
25.765
-3.762
-12.74%
jan 1, 1992
26.558
+0.793
3.08%
jan 1, 1993
16.21
-10.348
-38.97%
jan 1, 1994
15.097
-1.113
-6.87%
jan 1, 1995
18.942
+3.845
25.47%
jan 1, 1996
21.028
+2.086
11.01%
jan 1, 1997
20.133
-0.894
-4.25%
jan 1, 1998
20.23
+0.097
0.48%
jan 1, 1999
15.667
-4.563
-22.56%
jan 1, 2000
14.951
-0.716
-4.57%
jan 1, 2001
11.771
-3.18
-21.27%
jan 1, 2002
12.107
+0.336
2.85%
jan 1, 2003
14.785
+2.678
22.12%
jan 1, 2004
16.434
+1.649
11.15%
jan 1, 2005
13.065
-3.369
-20.5%
jan 1, 2006
10.523
-2.542
-19.46%
jan 1, 2007
13.883
+3.361
31.94%
jan 1, 2008
6.431
-7.452
-53.68%
jan 1, 2010
6.359
-0.072
-1.12%
jan 1, 2011
5.529
-0.83
-13.06%
jan 1, 2012
6.205
+0.676
12.23%
Ranking of countries by current statistics by years


Comments: