29
/
en
AIzaSyAYiBZKx7MnpbEhh9jyipgxe19OcubqV5w
April 1, 2024
157114
Iran, Islamic Rep.
IRN
true
2
1
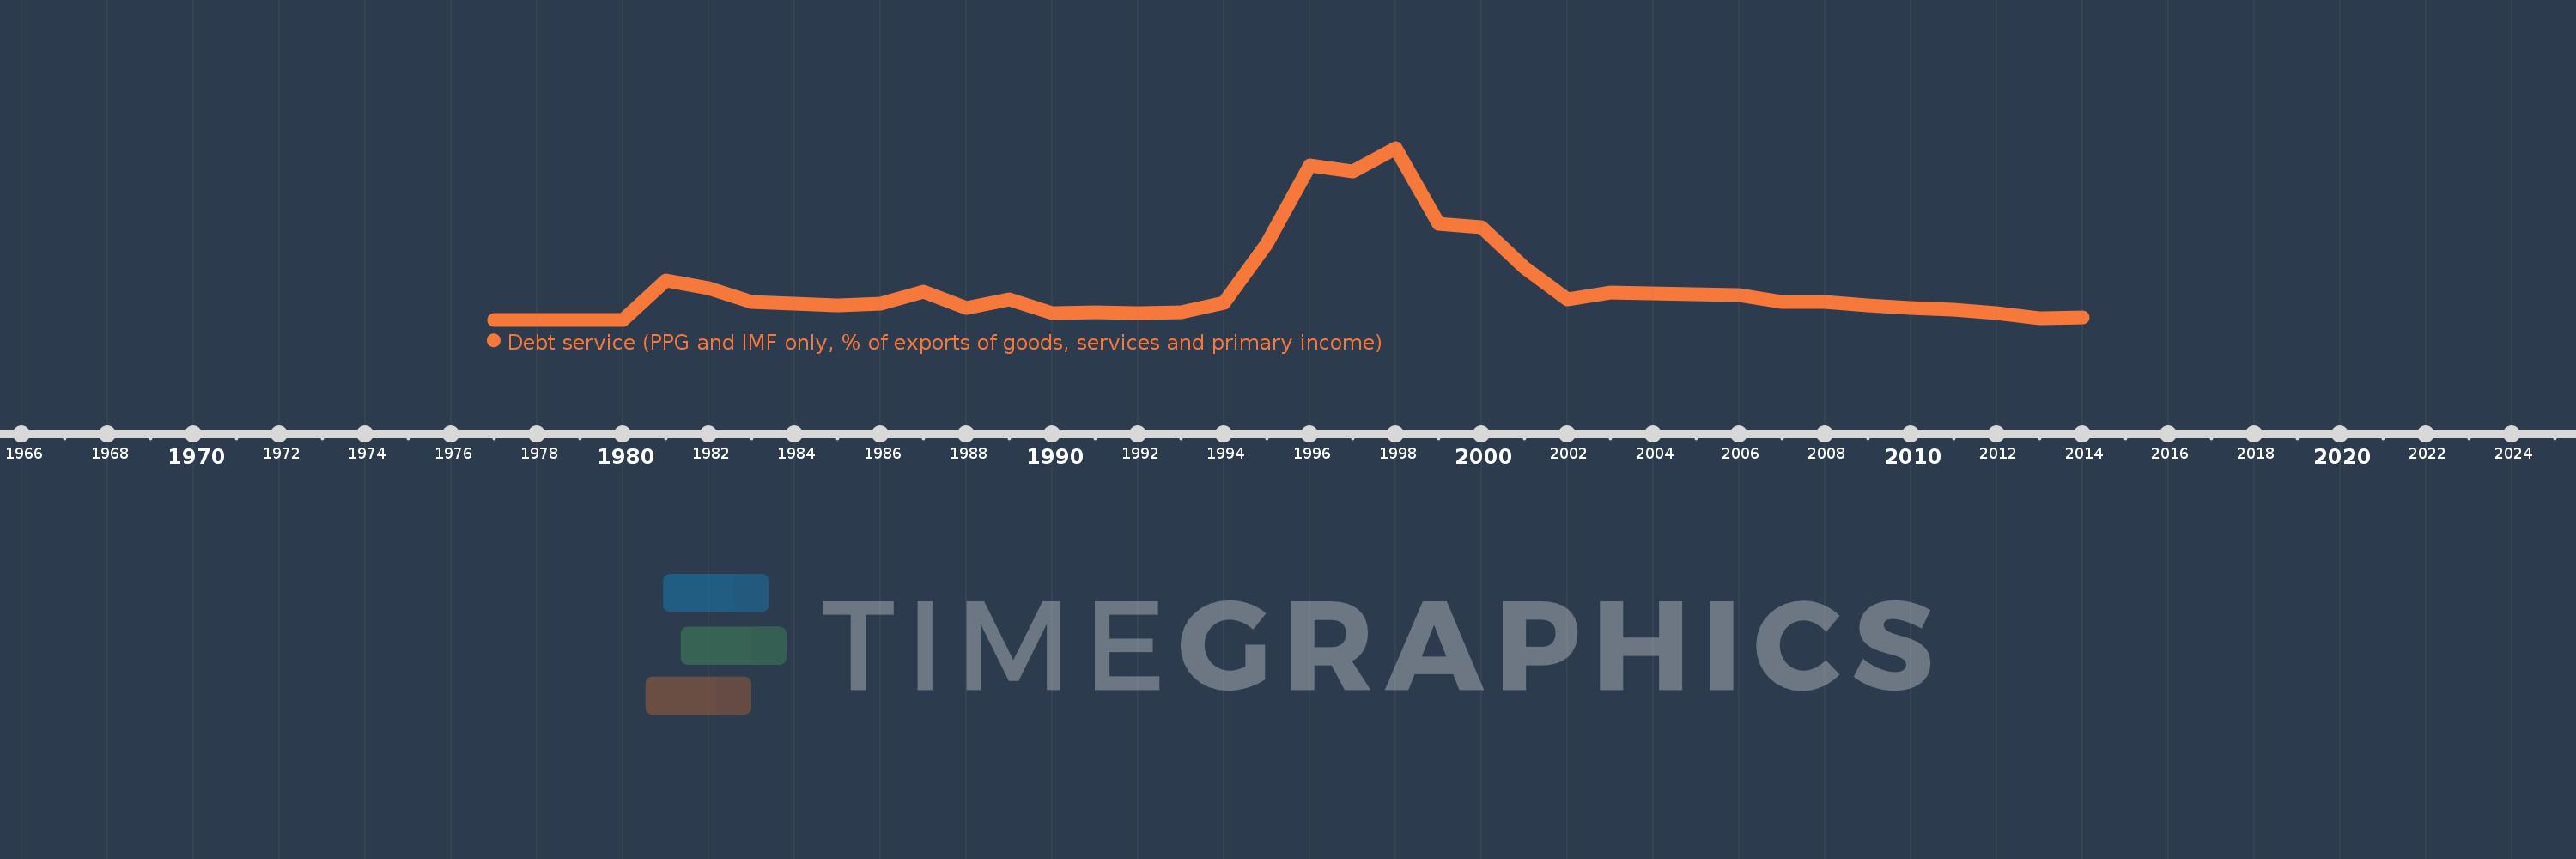
Debt service (PPG and IMF only, % of exports of goods, services and primary income)
2014,2013,2012,2011,2010,2009,2008,2007,2006,2005,2004,2003,2002,2001,2000,1999,1998,1997,1996,1995,1994,1993,1992,1991,1990,1989,1988,1987,1986,1985,1984,1983,1982,1981,1980,1979,1978,1977
This statistics in other country:
Timeline:
This timeline shows a graph from 1977 to 2014 of Iran, Islamic Rep.. No data until 1976. Number of actual observations by date: 38.
Source name:
World Development Indicators
Source organization:
World Bank, International Debt Statistics.
Categories, topics:
External Debt
Last updated:
apr 23, 2017
Indicators value changes by year
Maximum:
30.109
jan 1, 1998
At the date of observation
Value
Absolute change
Change from previous value
jan 1, 1981
6.812
+6.812
%
jan 1, 1982
5.571
-1.242
-18.23%
jan 1, 1983
3.062
-2.509
-45.04%
jan 1, 1984
2.88
-0.182
-5.93%
jan 1, 1985
2.475
-0.405
-14.06%
jan 1, 1986
2.755
+0.28
11.31%
jan 1, 1987
4.911
+2.156
78.26%
jan 1, 1988
2.043
-2.868
-58.4%
jan 1, 1989
3.546
+1.502
73.54%
jan 1, 1990
1.21
-2.336
-65.88%
jan 1, 1991
1.252
+0.042
3.5%
jan 1, 1992
1.15
-0.102
-8.15%
jan 1, 1993
1.379
+0.229
19.89%
jan 1, 1994
2.958
+1.579
114.53%
jan 1, 1995
13.296
+10.338
349.54%
jan 1, 1996
27.126
+13.83
104.02%
jan 1, 1997
25.982
-1.144
-4.22%
jan 1, 1998
30.109
+4.127
15.88%
jan 1, 1999
16.808
-13.301
-44.18%
jan 1, 2000
16.277
-0.531
-3.16%
jan 1, 2001
9.129
-7.149
-43.92%
jan 1, 2002
3.566
-5.563
-60.94%
jan 1, 2003
4.753
+1.188
33.31%
jan 1, 2004
4.616
-0.137
-2.88%
jan 1, 2005
4.519
-0.097
-2.1%
jan 1, 2006
4.26
-0.259
-5.72%
jan 1, 2007
3.162
-1.099
-25.79%
jan 1, 2008
3.085
-0.077
-2.44%
jan 1, 2009
2.443
-0.642
-20.81%
jan 1, 2010
2.07
-0.372
-15.24%
jan 1, 2011
1.753
-0.317
-15.32%
jan 1, 2012
1.215
-0.538
-30.69%
jan 1, 2013
0.309
-0.906
-74.53%
jan 1, 2014
0.365
+0.055
17.86%
Ranking of countries by current statistics by years


Comments: