29
/
en
AIzaSyAYiBZKx7MnpbEhh9jyipgxe19OcubqV5w
April 1, 2024
183694
Macedonia, FYR
MKD
true
2
1
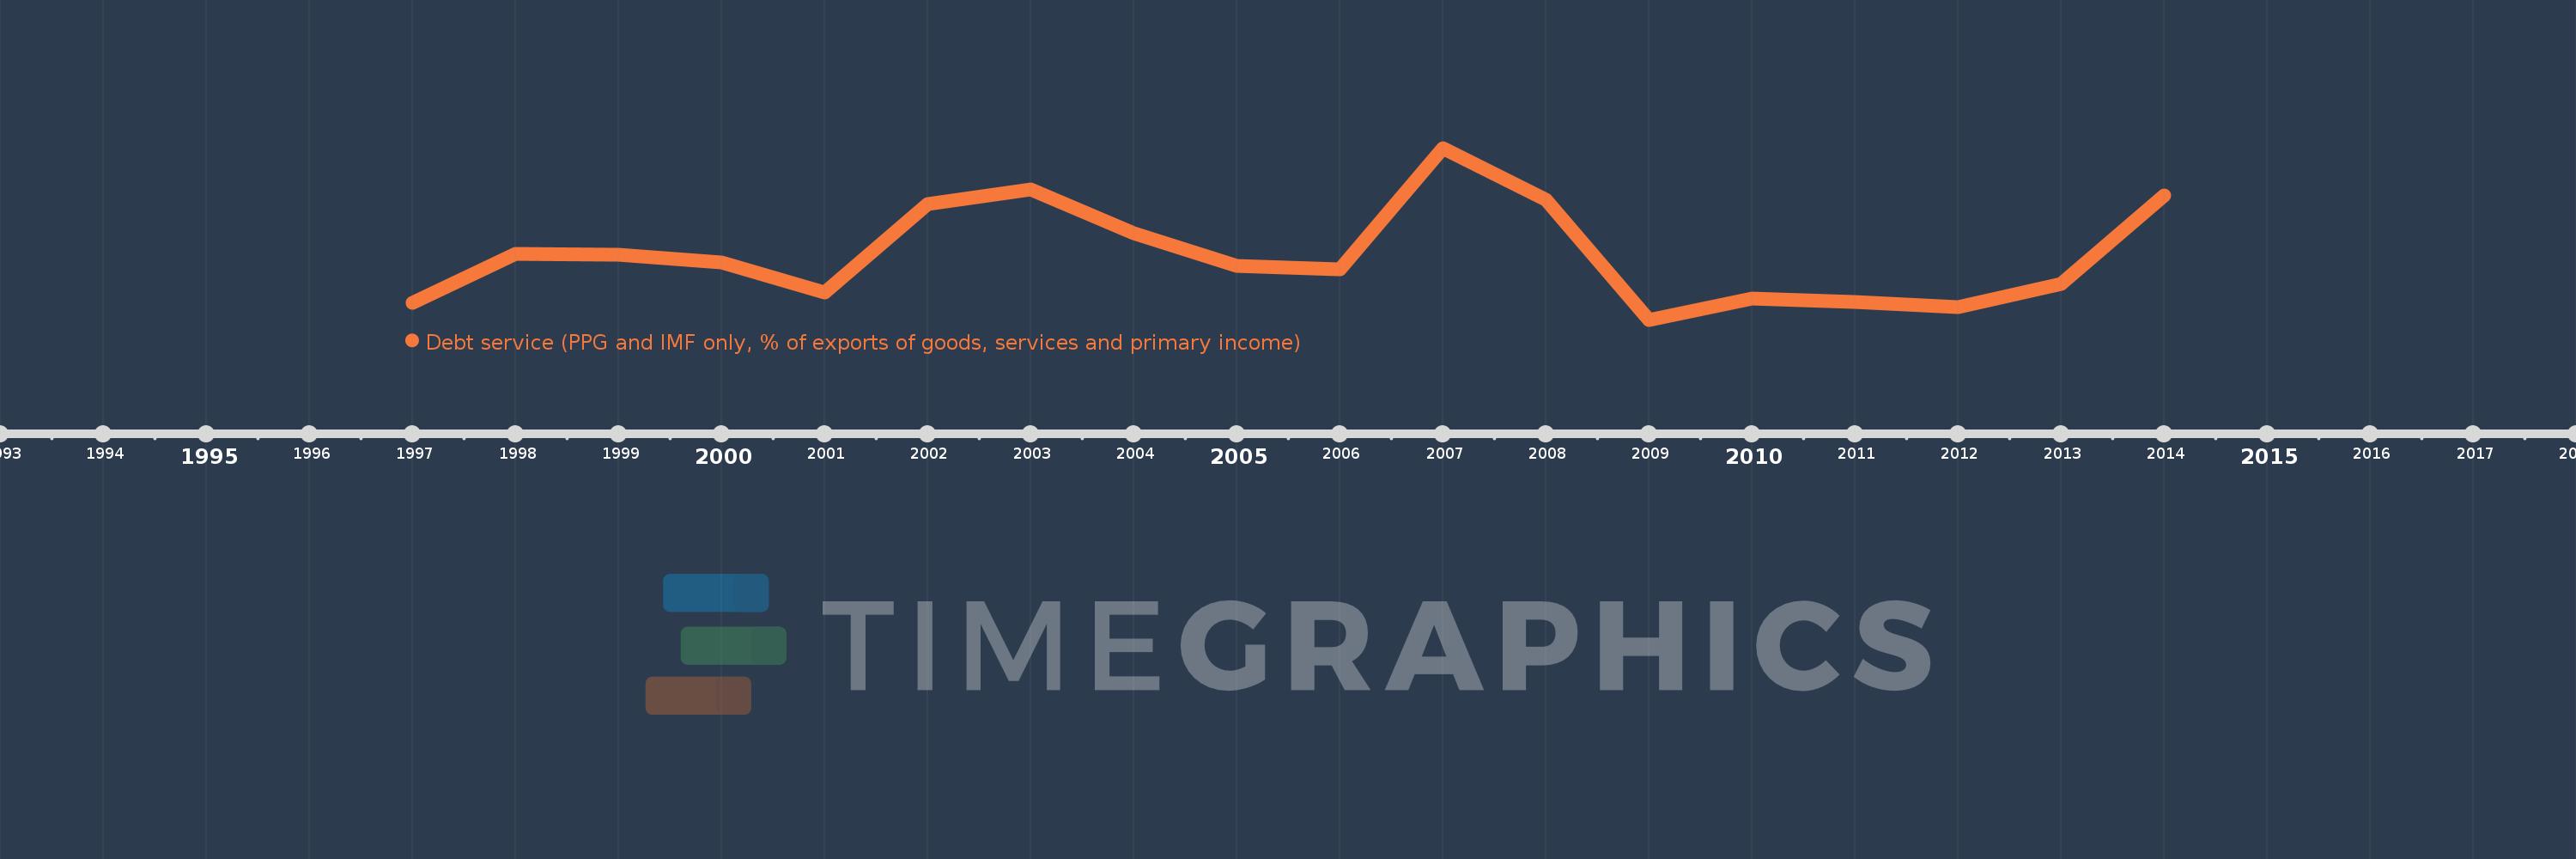
Debt service (PPG and IMF only, % of exports of goods, services and primary income)
2014,2013,2012,2011,2010,2009,2008,2007,2006,2005,2004,2003,2002,2001,2000,1999,1998,1997
This statistics in other country:
Timeline:
This timeline shows a graph from 1997 to 2014 of Macedonia, FYR. No data until 1996. Number of actual observations by date: 18.
Source name:
World Development Indicators
Source organization:
World Bank, International Debt Statistics.
Categories, topics:
External Debt
Last updated:
apr 23, 2017
Indicators value changes by year
Maximum:
13.864
jan 1, 2007
At the date of observation
Value
Absolute change
Change from previous value
jan 1, 1997
4.006
+4.006
0.0%
jan 1, 1998
7.111
+3.105
77.5%
jan 1, 1999
7.057
-0.055
-0.77%
jan 1, 2000
6.593
-0.464
-6.58%
jan 1, 2001
4.649
-1.944
-29.48%
jan 1, 2002
10.319
+5.67
121.95%
jan 1, 2003
11.233
+0.914
8.86%
jan 1, 2004
8.449
-2.784
-24.79%
jan 1, 2005
6.356
-2.092
-24.77%
jan 1, 2006
6.13
-0.226
-3.55%
jan 1, 2007
13.864
+7.734
126.15%
jan 1, 2008
10.55
-3.314
-23.9%
jan 1, 2009
2.93
-7.62
-72.23%
jan 1, 2010
4.256
+1.326
45.25%
jan 1, 2011
4.084
-0.173
-4.06%
jan 1, 2012
3.753
-0.33
-8.09%
jan 1, 2013
5.207
+1.454
38.73%
jan 1, 2014
10.829
+5.622
107.98%
Ranking of countries by current statistics by years


Comments: