29
/
en
AIzaSyAYiBZKx7MnpbEhh9jyipgxe19OcubqV5w
April 1, 2024
63394
Afghanistan
AFG
true
2
1
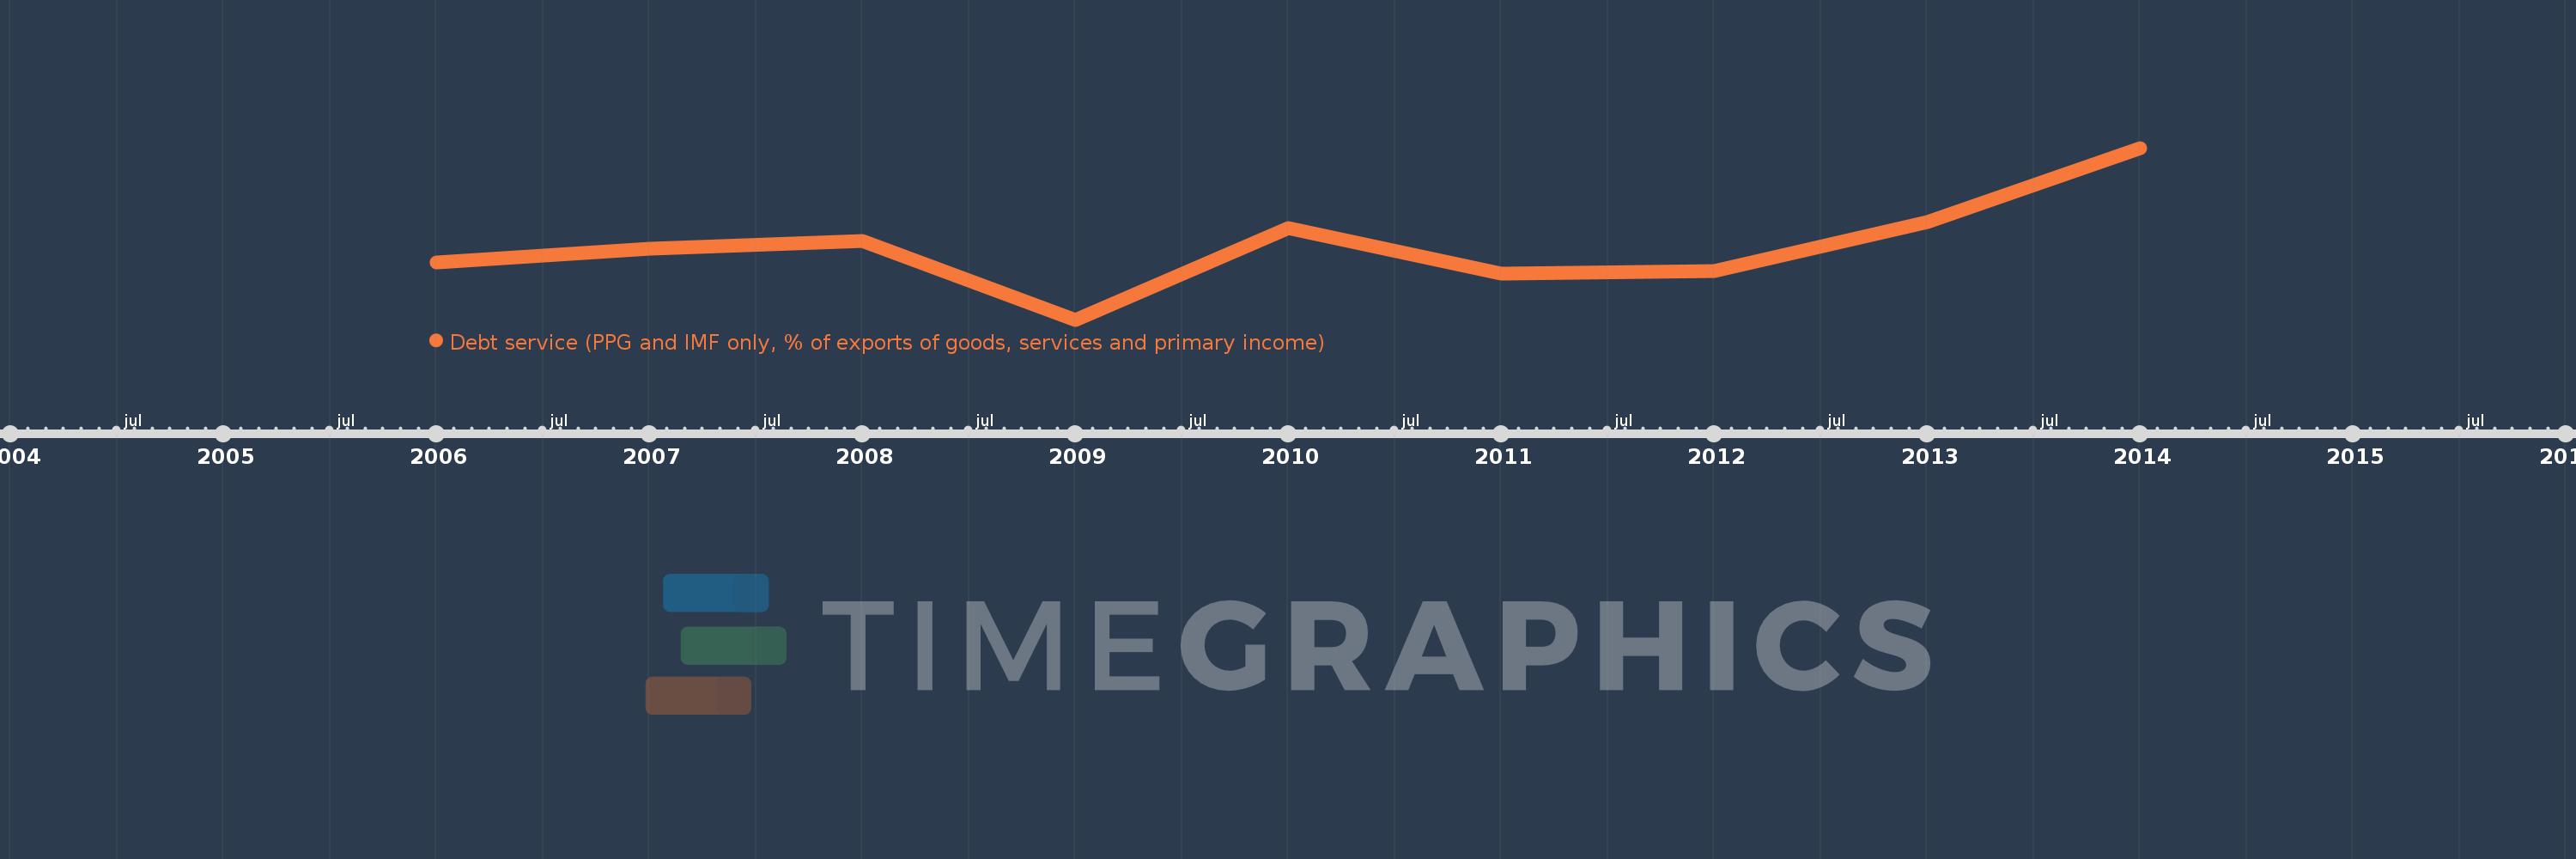
Debt service (PPG and IMF only, % of exports of goods, services and primary income)
2014,2013,2012,2011,2010,2009,2008,2007,2006
This statistics in other country:
Timeline:
This timeline shows a graph from 2006 to 2014 of Afghanistan. No data until 2005. Number of actual observations by date: 9.
Source name:
World Development Indicators
Source organization:
World Bank, International Debt Statistics.
Categories, topics:
External Debt
Last updated:
apr 23, 2017
Indicators value changes by year
At the date of observation
Value
Absolute change
Change from previous value
jan 1, 2006
0.481
+0.481
0.0%
jan 1, 2007
0.567
+0.086
17.88%
jan 1, 2008
0.619
+0.051
9.01%
jan 1, 2009
0.121
-0.498
-80.45%
jan 1, 2010
0.696
+0.575
475.1%
jan 1, 2011
0.412
-0.284
-40.76%
jan 1, 2012
0.429
+0.017
4.11%
jan 1, 2013
0.738
+0.309
72.01%
jan 1, 2014
1.202
+0.464
62.9%
Ranking of countries by current statistics by years


Comments: