29
/
en
AIzaSyAYiBZKx7MnpbEhh9jyipgxe19OcubqV5w
April 1, 2024
130292
Ethiopia
ETH
true
2
1
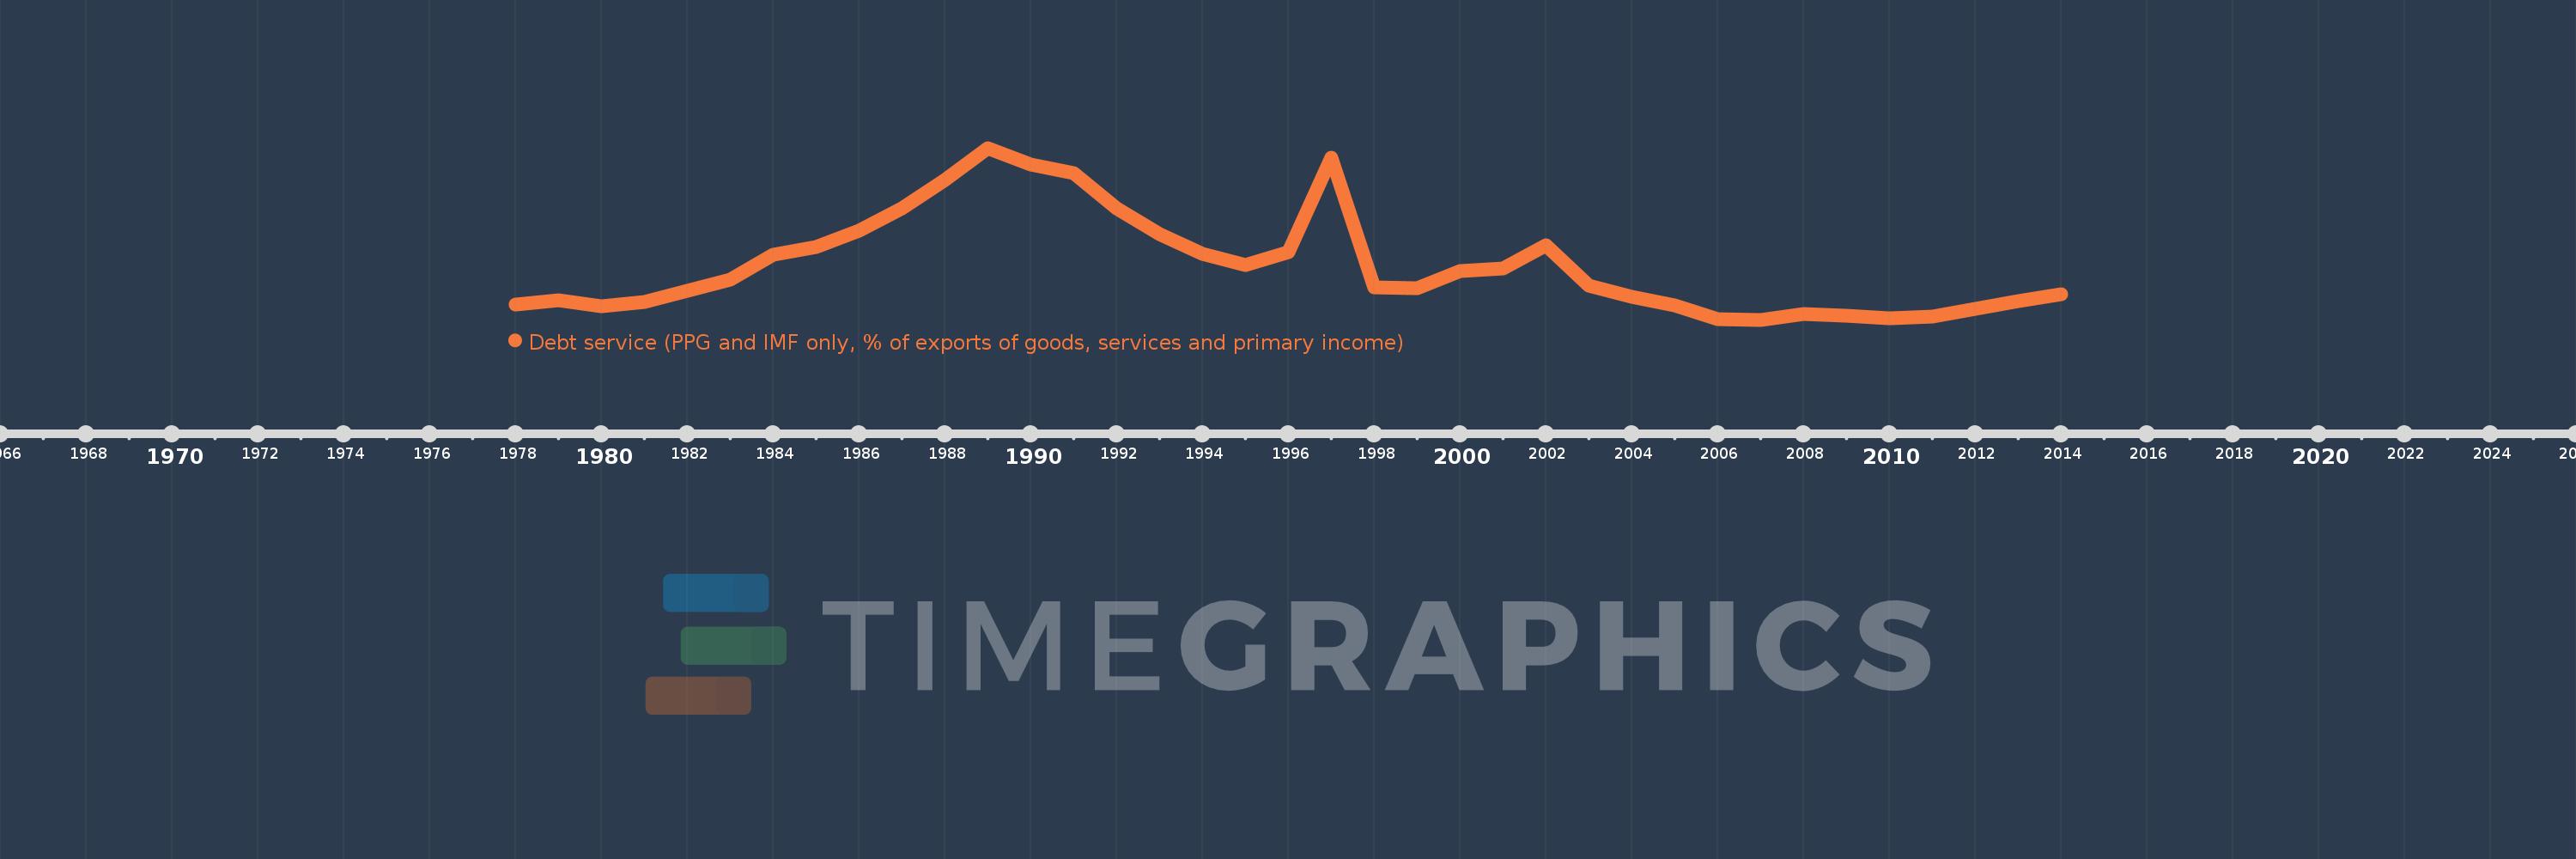
Debt service (PPG and IMF only, % of exports of goods, services and primary income)
2014,2013,2012,2011,2010,2009,2008,2007,2006,2005,2004,2003,2002,2001,2000,1999,1998,1997,1996,1995,1994,1993,1992,1991,1990,1989,1988,1987,1986,1985,1984,1983,1982,1981,1980,1979,1978
This statistics in other country:
Timeline:
This timeline shows a graph from 1978 to 2014 of Ethiopia. No data until 1977. Number of actual observations by date: 37.
Source name:
World Development Indicators
Source organization:
World Bank, International Debt Statistics.
Categories, topics:
External Debt
Last updated:
apr 23, 2017
Indicators value changes by year
At the date of observation
Value
Absolute change
Change from previous value
jan 1, 1978
5.761
+5.761
0.0%
jan 1, 1979
6.727
+0.966
16.77%
jan 1, 1980
5.334
-1.394
-20.71%
jan 1, 1981
6.337
+1.004
18.81%
jan 1, 1982
9.088
+2.751
43.41%
jan 1, 1983
11.649
+2.561
28.18%
jan 1, 1984
17.682
+6.032
51.78%
jan 1, 1985
19.668
+1.986
11.23%
jan 1, 1986
23.636
+3.969
20.18%
jan 1, 1987
29.021
+5.384
22.78%
jan 1, 1988
36.017
+6.997
24.11%
jan 1, 1989
43.75
+7.733
21.47%
jan 1, 1990
39.711
-4.039
-9.23%
jan 1, 1991
37.647
-2.064
-5.2%
jan 1, 1992
29.027
-8.619
-22.9%
jan 1, 1993
22.717
-6.311
-21.74%
jan 1, 1994
17.928
-4.789
-21.08%
jan 1, 1995
15.216
-2.712
-15.12%
jan 1, 1996
18.334
+3.118
20.49%
jan 1, 1997
41.484
+23.15
126.26%
jan 1, 1998
9.864
-31.621
-76.22%
jan 1, 1999
9.7
-0.164
-1.66%
jan 1, 2000
13.9
+4.2
43.3%
jan 1, 2001
14.515
+0.615
4.43%
jan 1, 2002
19.991
+5.476
37.72%
jan 1, 2003
10.308
-9.682
-48.43%
jan 1, 2004
7.59
-2.718
-26.37%
jan 1, 2005
5.38
-2.21
-29.11%
jan 1, 2006
2.144
-3.237
-60.16%
jan 1, 2007
1.971
-0.173
-8.05%
jan 1, 2008
3.456
+1.484
75.31%
jan 1, 2009
2.916
-0.54
-15.63%
jan 1, 2010
2.351
-0.565
-19.37%
jan 1, 2011
2.75
+0.399
16.98%
jan 1, 2012
4.536
+1.786
64.95%
jan 1, 2013
6.601
+2.065
45.52%
jan 1, 2014
8.133
+1.532
23.21%
Ranking of countries by current statistics by years


Comments: