29
/
en
AIzaSyAYiBZKx7MnpbEhh9jyipgxe19OcubqV5w
April 1, 2024
200216
Montenegro
MNE
true
2
1
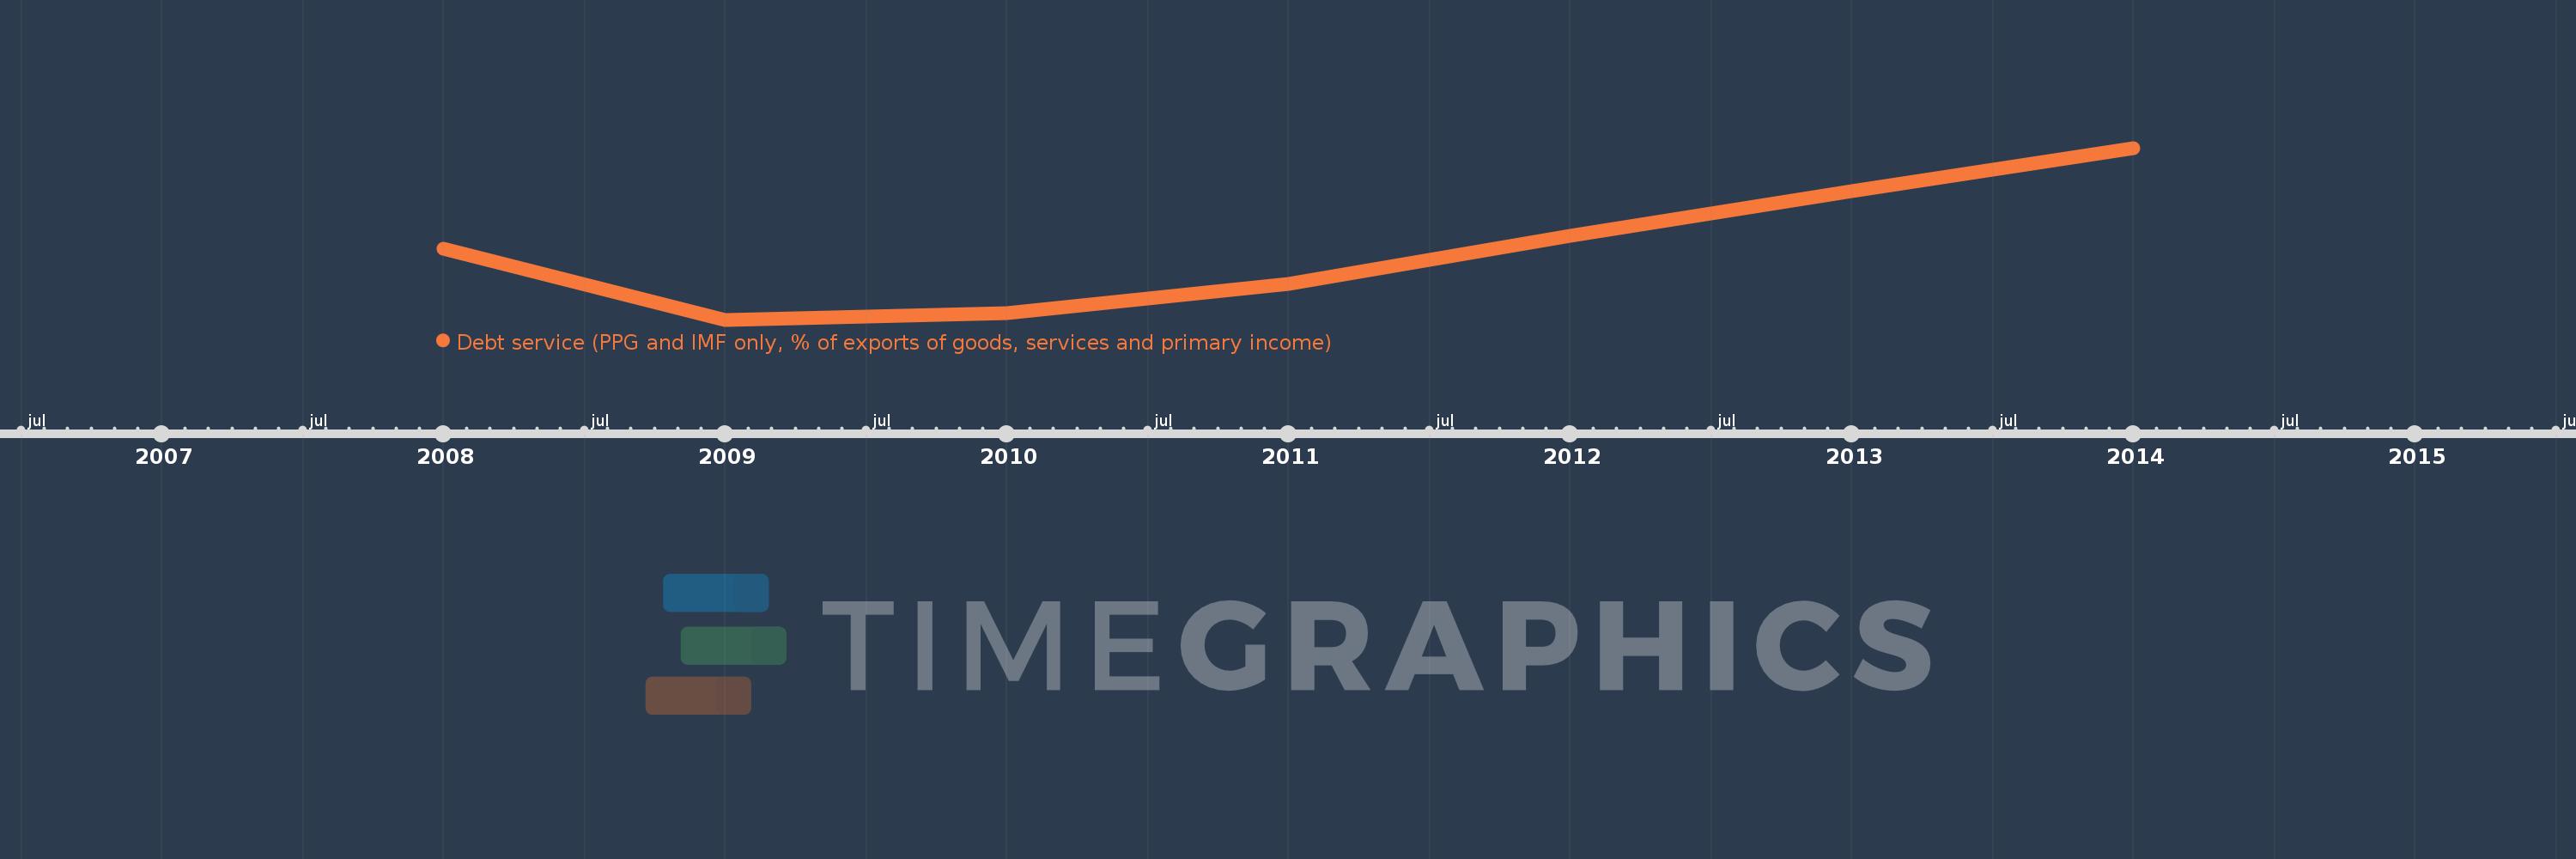
Debt service (PPG and IMF only, % of exports of goods, services and primary income)
2014,2013,2012,2011,2010,2009,2008
This statistics in other country:
Timeline:
This timeline shows a graph from 2008 to 2014 of Montenegro. No data until 2007. Number of actual observations by date: 7.
Source name:
World Development Indicators
Source organization:
World Bank, International Debt Statistics.
Categories, topics:
External Debt
Last updated:
apr 23, 2017
Indicators value changes by year
Maximum:
16.192
jan 1, 2014
At the date of observation
Value
Absolute change
Change from previous value
jan 1, 2008
8.169
+8.169
0.0%
jan 1, 2009
2.547
-5.622
-68.82%
jan 1, 2010
3.091
+0.545
21.38%
jan 1, 2011
5.41
+2.319
75.02%
jan 1, 2012
9.23
+3.819
70.59%
jan 1, 2013
12.782
+3.552
38.49%
jan 1, 2014
16.192
+3.41
26.68%
Ranking of countries by current statistics by years


Comments: