29
/
en
AIzaSyAYiBZKx7MnpbEhh9jyipgxe19OcubqV5w
April 1, 2024
222001
Peru
PER
true
2
1
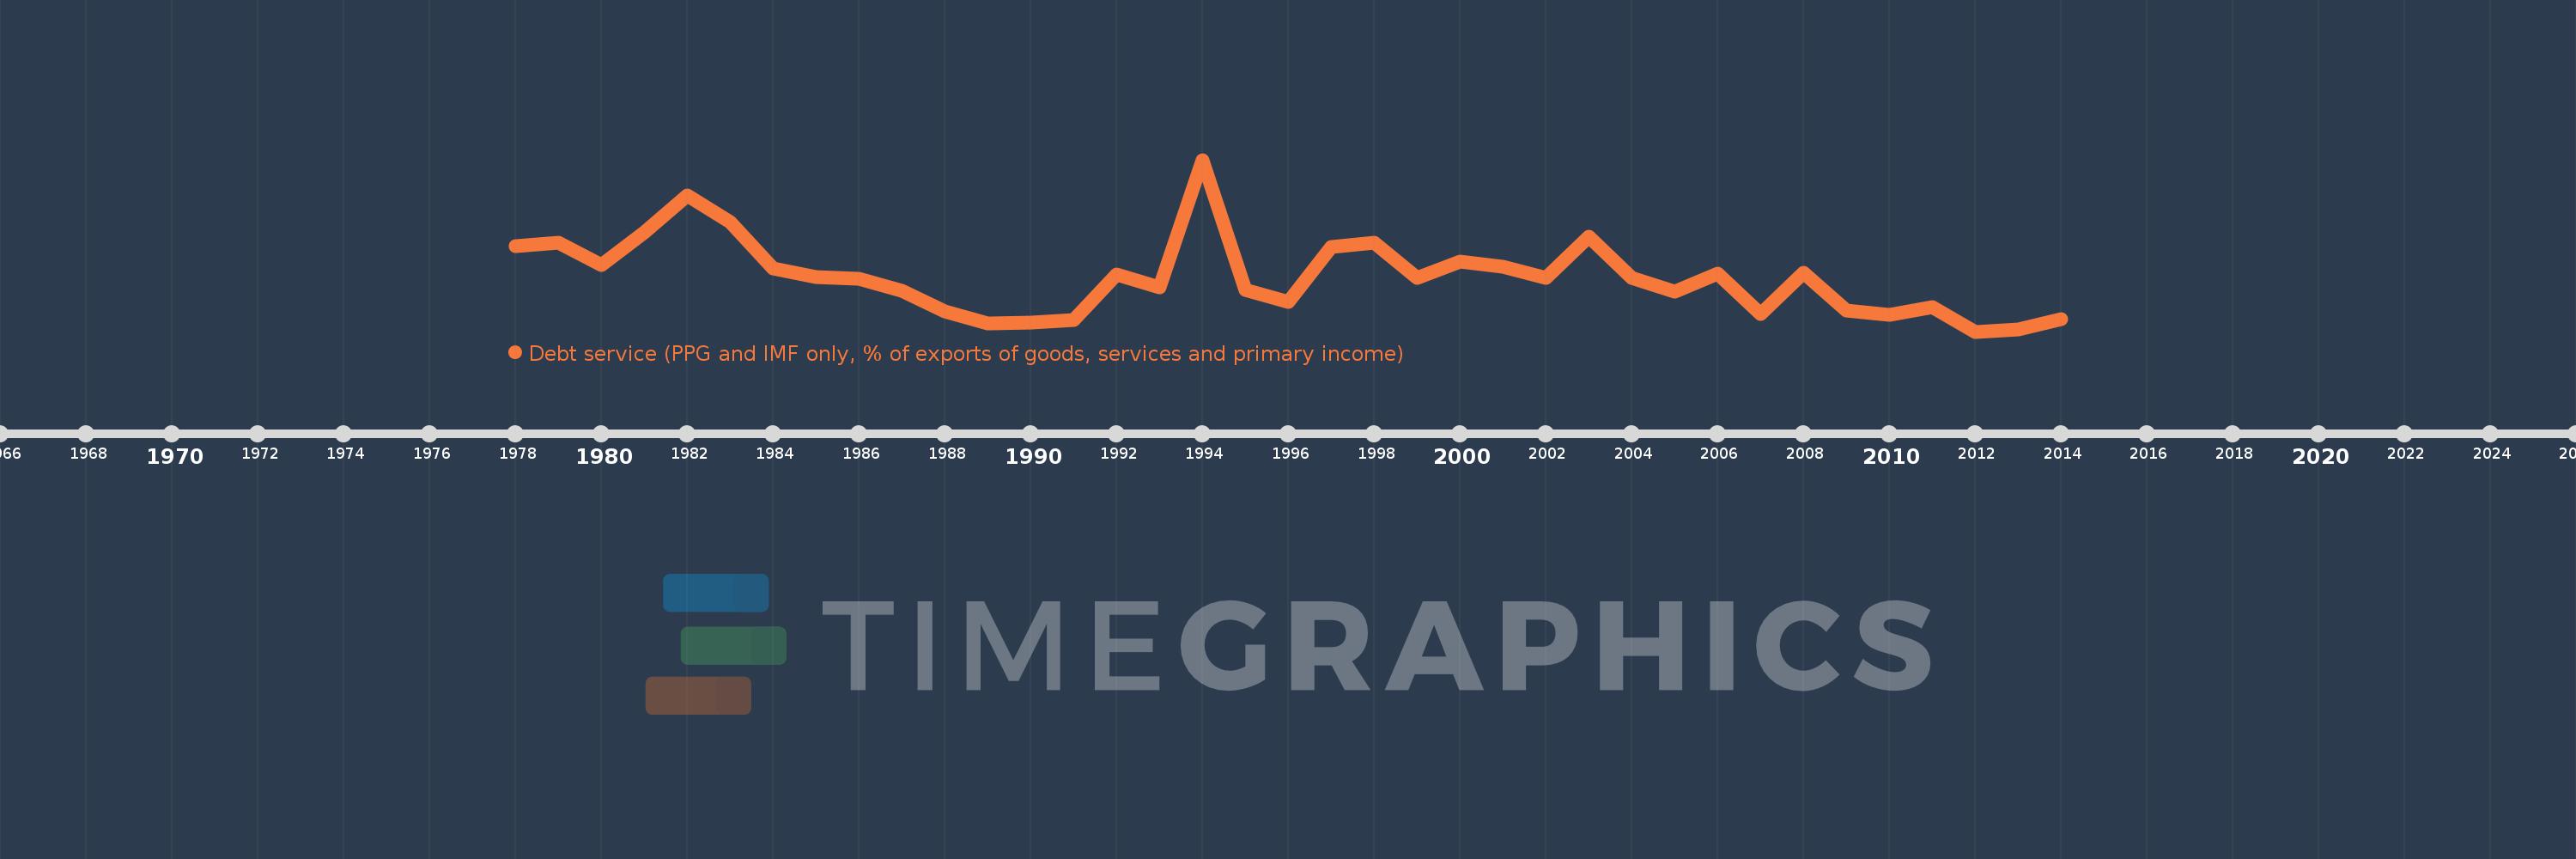
Debt service (PPG and IMF only, % of exports of goods, services and primary income)
2014,2013,2012,2011,2010,2009,2008,2007,2006,2005,2004,2003,2002,2001,2000,1999,1998,1997,1996,1995,1994,1993,1992,1991,1990,1989,1988,1987,1986,1985,1984,1983,1982,1981,1980,1979,1978
This statistics in other country:
Timeline:
This timeline shows a graph from 1978 to 2014 of Peru. No data until 1977. Number of actual observations by date: 37.
Source name:
World Development Indicators
Source organization:
World Bank, International Debt Statistics.
Categories, topics:
External Debt
Last updated:
apr 23, 2017
Indicators value changes by year
Maximum:
59.061
jan 1, 1994
At the date of observation
Value
Absolute change
Change from previous value
jan 1, 1978
31.258
+31.258
0.0%
jan 1, 1979
32.383
+1.125
3.6%
jan 1, 1980
25.161
-7.222
-22.3%
jan 1, 1981
35.661
+10.499
41.73%
jan 1, 1982
47.658
+11.997
33.64%
jan 1, 1983
38.981
-8.677
-18.21%
jan 1, 1984
23.982
-14.999
-38.48%
jan 1, 1985
21.304
-2.678
-11.17%
jan 1, 1986
20.769
-0.535
-2.51%
jan 1, 1987
16.765
-4.004
-19.28%
jan 1, 1988
10.229
-6.536
-38.99%
jan 1, 1989
6.23
-3.999
-39.1%
jan 1, 1990
6.725
+0.496
7.96%
jan 1, 1991
7.33
+0.604
8.99%
jan 1, 1992
21.99
+14.66
200.01%
jan 1, 1993
17.99
-4.001
-18.19%
jan 1, 1994
59.061
+41.072
228.31%
jan 1, 1995
17.009
-42.052
-71.2%
jan 1, 1996
13.3
-3.709
-21.81%
jan 1, 1997
30.876
+17.576
132.15%
jan 1, 1998
32.487
+1.611
5.22%
jan 1, 1999
20.942
-11.546
-35.54%
jan 1, 2000
26.156
+5.215
24.9%
jan 1, 2001
24.55
-1.606
-6.14%
jan 1, 2002
21.133
-3.417
-13.92%
jan 1, 2003
34.398
+13.265
62.77%
jan 1, 2004
20.957
-13.441
-39.07%
jan 1, 2005
16.448
-4.509
-21.52%
jan 1, 2006
22.405
+5.957
36.22%
jan 1, 2007
9.501
-12.905
-57.6%
jan 1, 2008
22.77
+13.269
139.67%
jan 1, 2009
10.524
-12.246
-53.78%
jan 1, 2010
9.179
-1.346
-12.79%
jan 1, 2011
11.475
+2.297
25.02%
jan 1, 2012
3.71
-7.765
-67.67%
jan 1, 2013
4.482
+0.772
20.82%
jan 1, 2014
7.799
+3.316
73.99%
Ranking of countries by current statistics by years


Comments: