29
/
en
AIzaSyAYiBZKx7MnpbEhh9jyipgxe19OcubqV5w
April 1, 2024
178717
Liberia
LBR
true
2
1
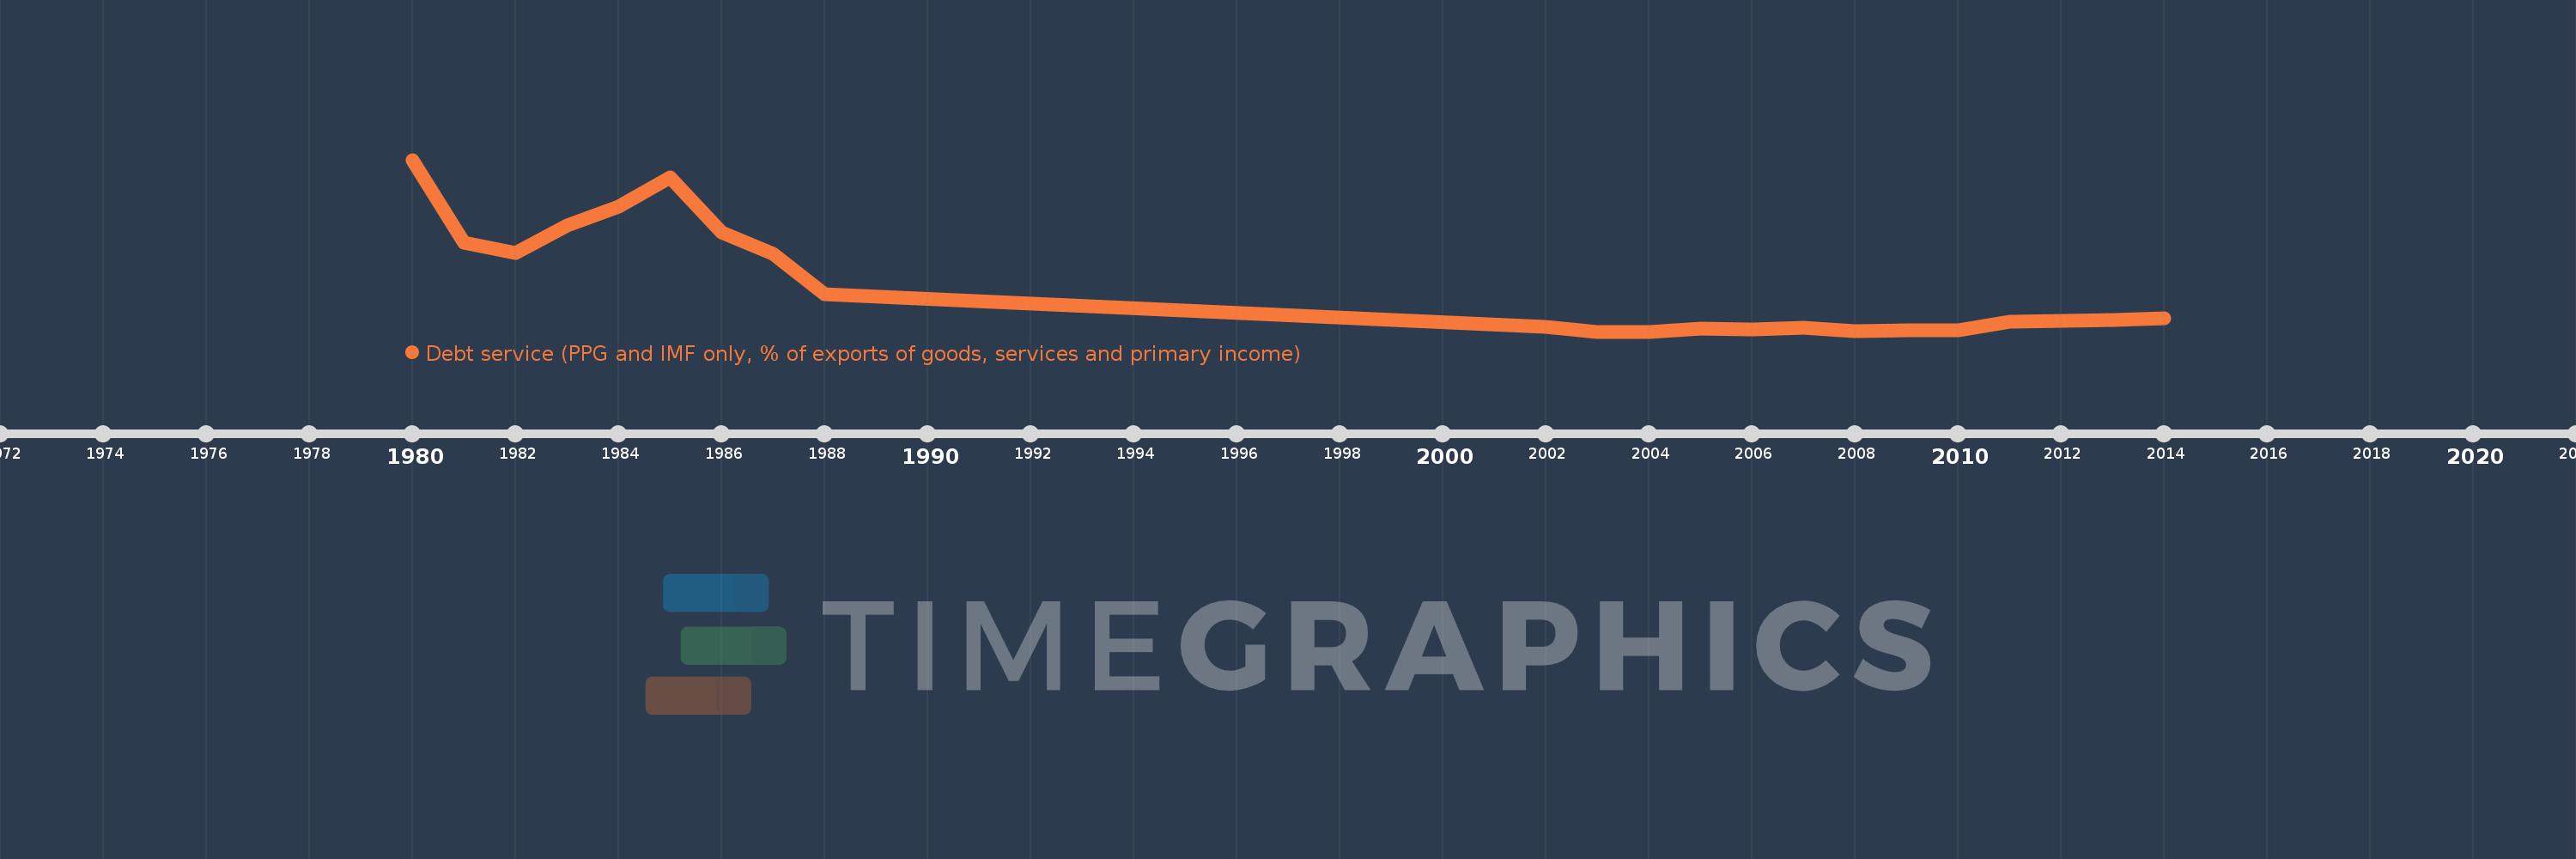
Debt service (PPG and IMF only, % of exports of goods, services and primary income)
2014,2013,2012,2011,2010,2009,2008,2007,2006,2005,2004,2003,2002,1988,1987,1986,1985,1984,1983,1982,1981,1980
This statistics in other country:
Timeline:
This timeline shows a graph from 1980 to 2014 of Liberia. No data until 1979. Number of actual observations by date: 22.
Source name:
World Development Indicators
Source organization:
World Bank, International Debt Statistics.
Categories, topics:
External Debt
Last updated:
apr 23, 2017
Indicators value changes by year
Maximum:
13.512
jan 1, 1980
At the date of observation
Value
Absolute change
Change from previous value
jan 1, 1980
13.512
+13.512
0.0%
jan 1, 1981
6.969
-6.543
-48.43%
jan 1, 1982
6.2
-0.769
-11.04%
jan 1, 1983
8.34
+2.14
34.52%
jan 1, 1984
9.82
+1.48
17.75%
jan 1, 1985
12.159
+2.339
23.82%
jan 1, 1986
7.771
-4.388
-36.09%
jan 1, 1987
6.121
-1.65
-21.24%
jan 1, 1988
2.906
-3.215
-52.53%
jan 1, 2002
0.35
-2.555
-87.94%
jan 1, 2003
0.0
-0.35
-100.0%
jan 1, 2005
0.255
+0.255
%
jan 1, 2006
0.186
-0.069
-27.09%
jan 1, 2007
0.291
+0.106
56.92%
jan 1, 2008
0.038
-0.253
-86.96%
jan 1, 2009
0.118
+0.08
209.4%
jan 1, 2010
0.089
-0.029
-24.56%
jan 1, 2011
0.765
+0.676
762.44%
jan 1, 2012
0.867
+0.102
13.34%
jan 1, 2013
0.929
+0.061
7.09%
jan 1, 2014
1.026
+0.097
10.47%
Ranking of countries by current statistics by years


Comments: