29
/
en
AIzaSyAYiBZKx7MnpbEhh9jyipgxe19OcubqV5w
April 1, 2024
273396
Ukraine
UKR
true
2
1
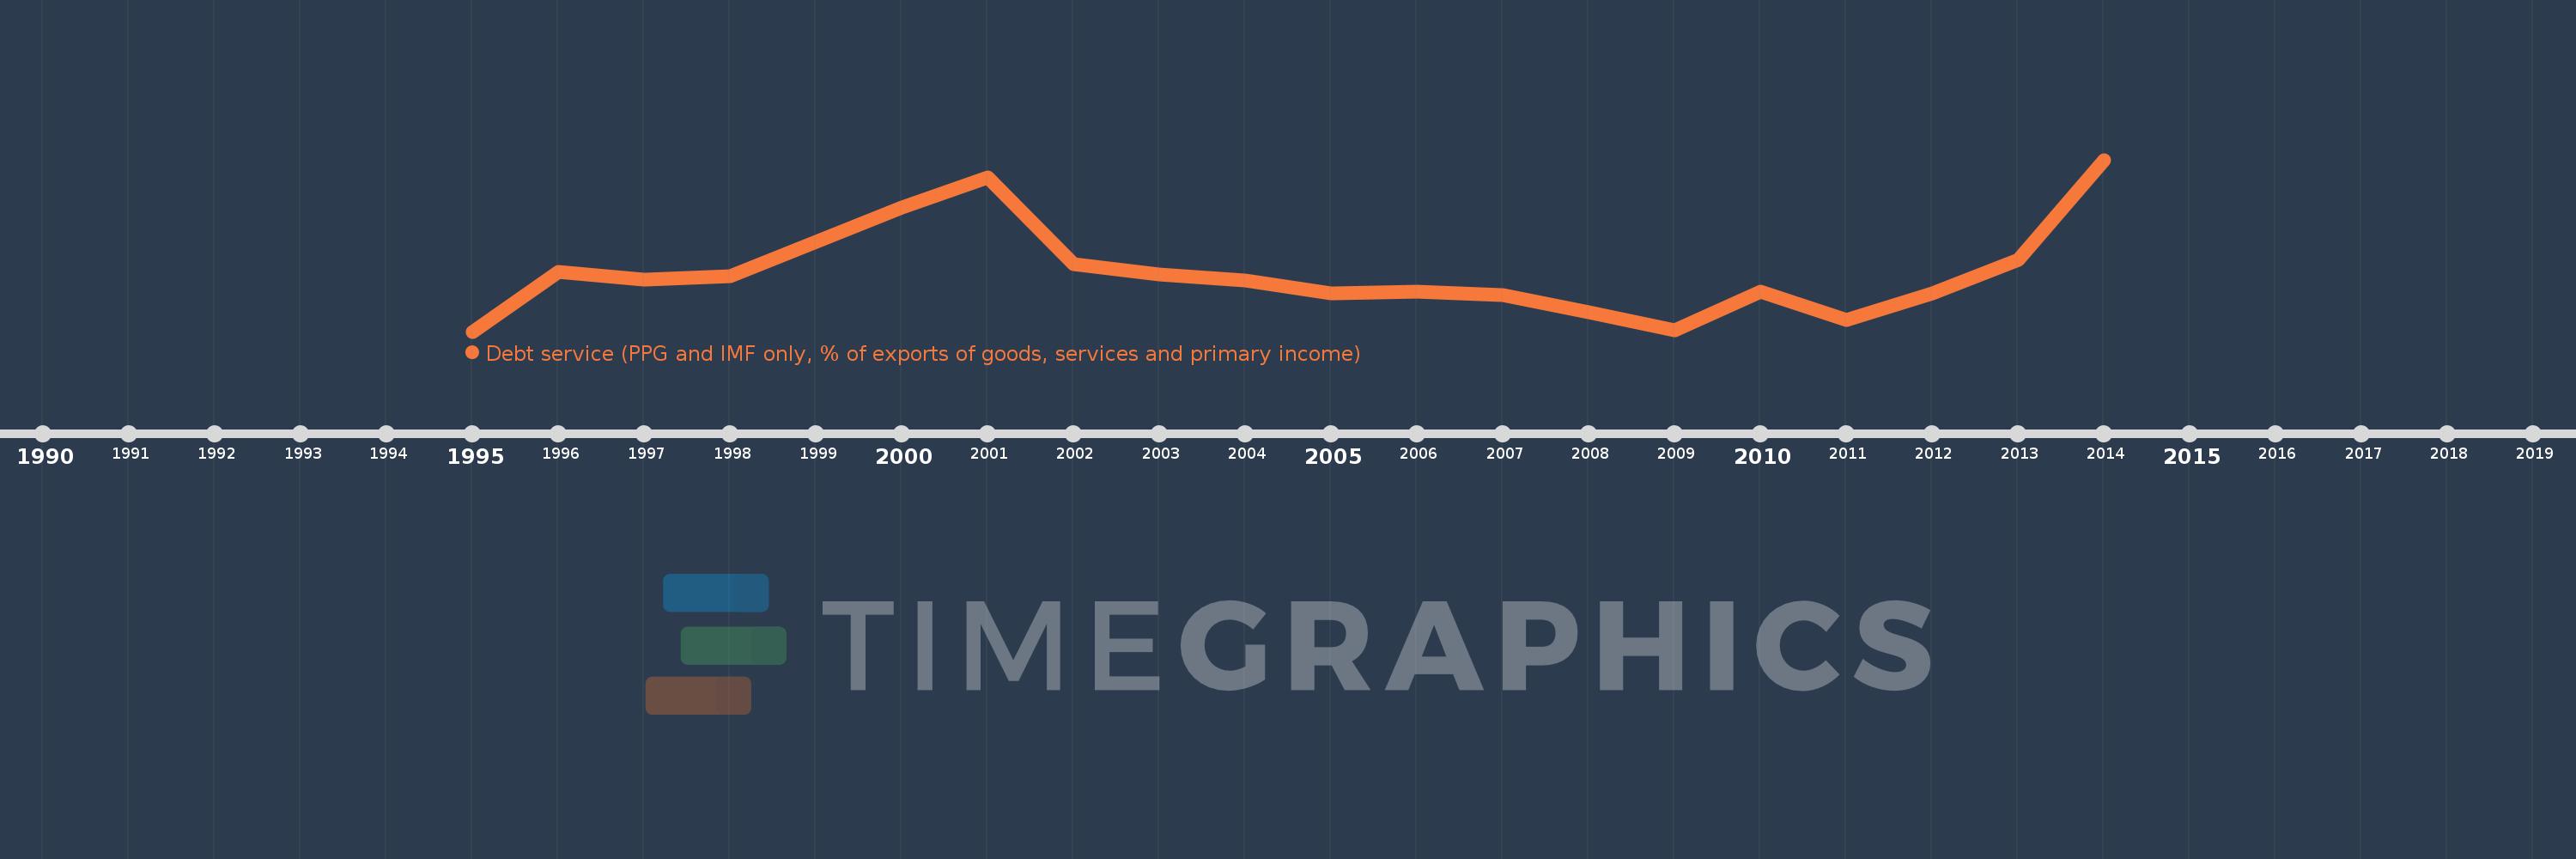
Debt service (PPG and IMF only, % of exports of goods, services and primary income)
2014,2013,2012,2011,2010,2009,2008,2007,2006,2005,2004,2003,2002,2001,2000,1999,1998,1997,1996,1995
This statistics in other country:
Timeline:
This timeline shows a graph from 1995 to 2014 of Ukraine. No data until 1994. Number of actual observations by date: 20.
Source name:
World Development Indicators
Source organization:
World Bank, International Debt Statistics.
Categories, topics:
External Debt
Last updated:
apr 23, 2017
Indicators value changes by year
Maximum:
14.965
jan 1, 2014
At the date of observation
Value
Absolute change
Change from previous value
jan 1, 1995
1.53
+1.53
0.0%
jan 1, 1996
6.215
+4.685
306.2%
jan 1, 1997
5.619
-0.596
-9.59%
jan 1, 1998
5.85
+0.231
4.12%
jan 1, 1999
8.549
+2.699
46.13%
jan 1, 2000
11.232
+2.682
31.38%
jan 1, 2001
13.585
+2.353
20.95%
jan 1, 2002
6.773
-6.812
-50.15%
jan 1, 2003
5.972
-0.801
-11.82%
jan 1, 2004
5.534
-0.438
-7.33%
jan 1, 2005
4.536
-0.997
-18.02%
jan 1, 2006
4.669
+0.132
2.92%
jan 1, 2007
4.355
-0.314
-6.72%
jan 1, 2008
3.061
-1.294
-29.72%
jan 1, 2009
1.64
-1.421
-46.43%
jan 1, 2010
4.639
+2.999
182.94%
jan 1, 2011
2.414
-2.225
-47.97%
jan 1, 2012
4.524
+2.111
87.45%
jan 1, 2013
7.138
+2.614
57.77%
jan 1, 2014
14.965
+7.828
109.67%
Ranking of countries by current statistics by years


Comments: