29
/
en
AIzaSyAYiBZKx7MnpbEhh9jyipgxe19OcubqV5w
April 1, 2024
82616
Belize
BLZ
true
2
1
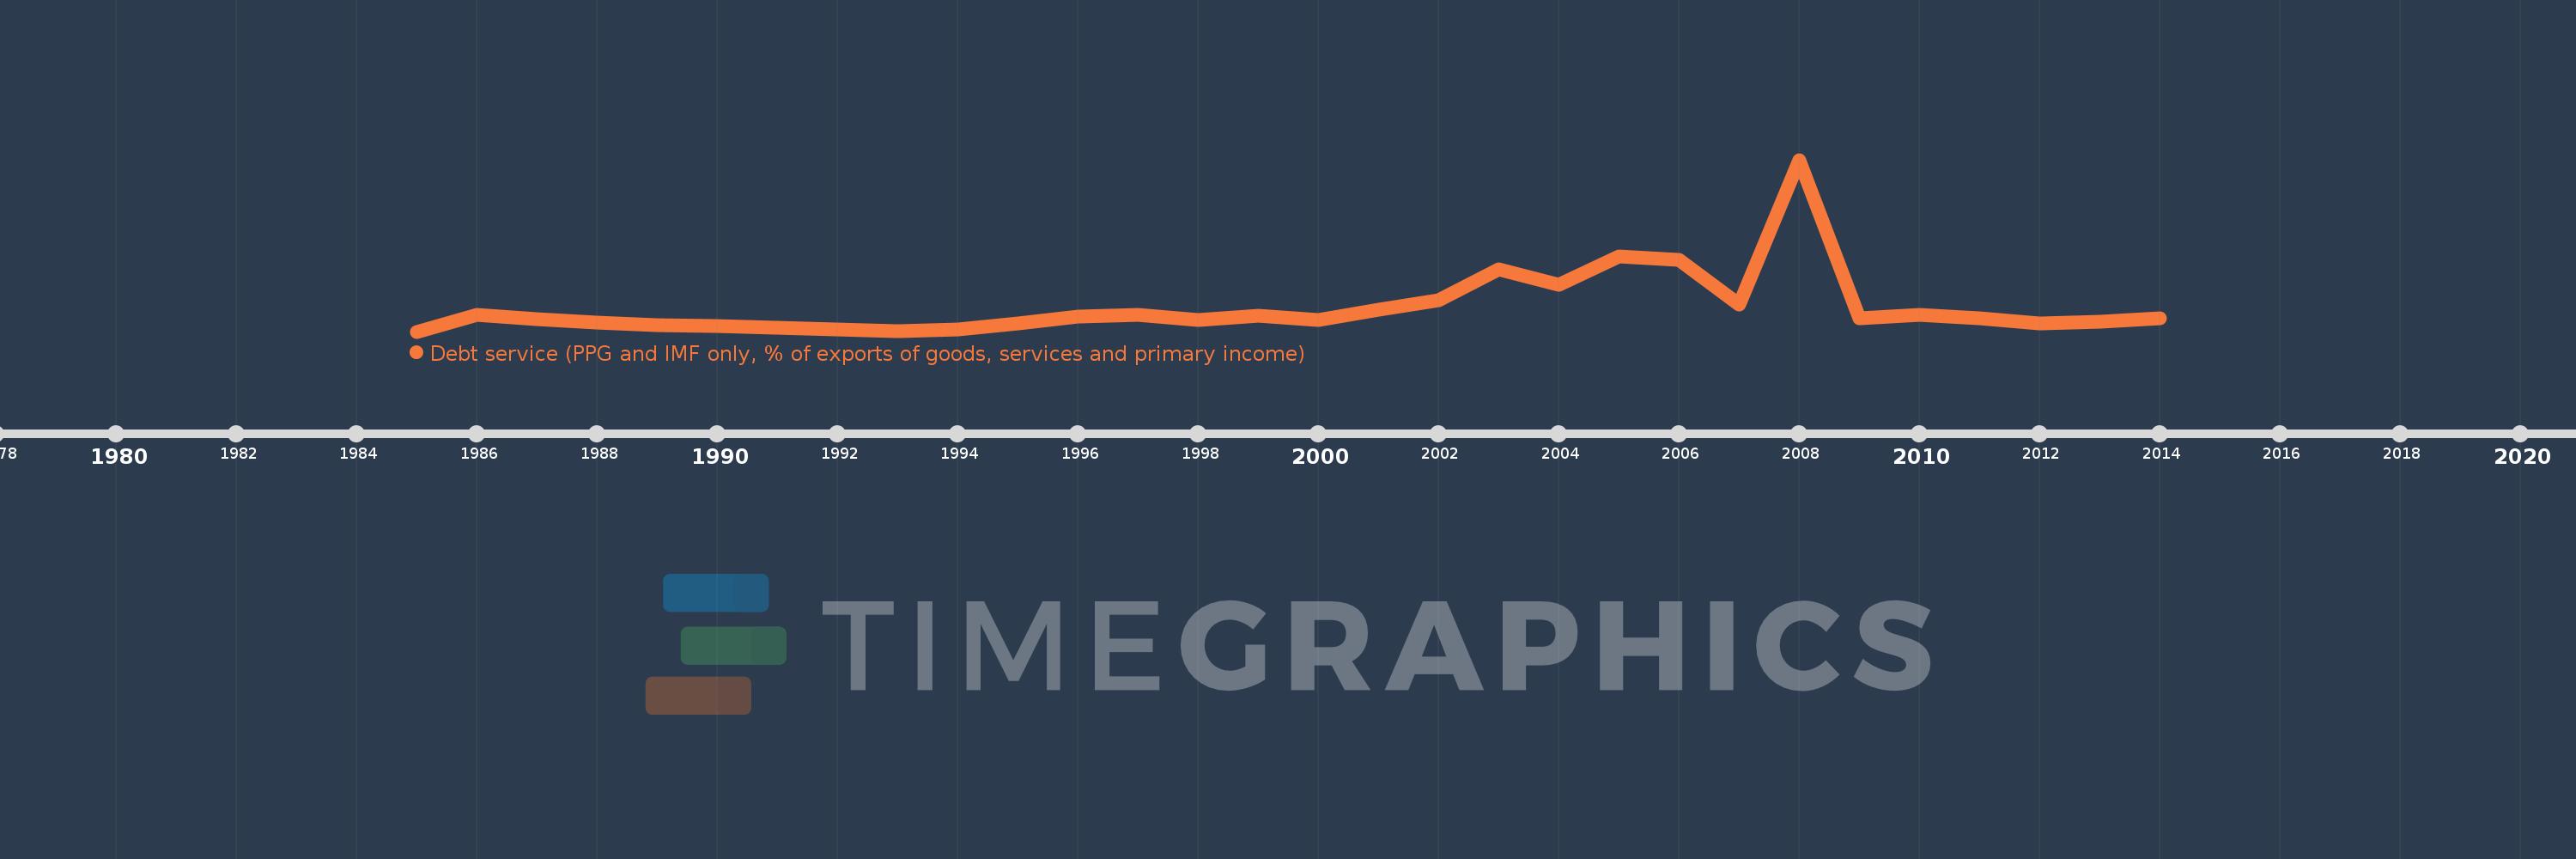
Debt service (PPG and IMF only, % of exports of goods, services and primary income)
2014,2013,2012,2011,2010,2009,2008,2007,2006,2005,2004,2003,2002,2001,2000,1999,1998,1997,1996,1995,1994,1993,1992,1991,1990,1989,1988,1987,1986,1985
This statistics in other country:
Timeline:
This timeline shows a graph from 1985 to 2014 of Belize. No data until 1984. Number of actual observations by date: 30.
Source name:
World Development Indicators
Source organization:
World Bank, International Debt Statistics.
Categories, topics:
External Debt
Last updated:
apr 23, 2017
Indicators value changes by year
Maximum:
78.123
jan 1, 2008
At the date of observation
Value
Absolute change
Change from previous value
jan 1, 1985
5.225
+5.225
0.0%
jan 1, 1986
12.491
+7.266
139.07%
jan 1, 1987
10.471
-2.02
-16.17%
jan 1, 1988
8.928
-1.543
-14.73%
jan 1, 1989
7.904
-1.024
-11.47%
jan 1, 1990
7.706
-0.198
-2.51%
jan 1, 1991
7.014
-0.692
-8.98%
jan 1, 1992
6.196
-0.818
-11.67%
jan 1, 1993
5.425
-0.771
-12.44%
jan 1, 1994
5.993
+0.567
10.46%
jan 1, 1995
8.522
+2.529
42.2%
jan 1, 1996
11.744
+3.223
37.82%
jan 1, 1997
12.182
+0.437
3.72%
jan 1, 1998
10.282
-1.899
-15.59%
jan 1, 1999
12.028
+1.745
16.97%
jan 1, 2000
10.092
-1.935
-16.09%
jan 1, 2001
14.525
+4.433
43.93%
jan 1, 2002
18.48
+3.955
27.23%
jan 1, 2003
31.62
+13.14
71.11%
jan 1, 2004
24.927
-6.692
-21.17%
jan 1, 2005
37.059
+12.132
48.67%
jan 1, 2006
35.705
-1.354
-3.65%
jan 1, 2007
16.717
-18.988
-53.18%
jan 1, 2008
78.123
+61.406
367.32%
jan 1, 2009
10.865
-67.258
-86.09%
jan 1, 2010
12.294
+1.429
13.15%
jan 1, 2011
10.896
-1.398
-11.37%
jan 1, 2012
8.796
-2.099
-19.27%
jan 1, 2013
9.27
+0.473
5.38%
jan 1, 2014
10.784
+1.514
16.33%
Ranking of countries by current statistics by years


Comments: