29
/
en
AIzaSyAYiBZKx7MnpbEhh9jyipgxe19OcubqV5w
April 1, 2024
135369
Gabon
GAB
true
2
1
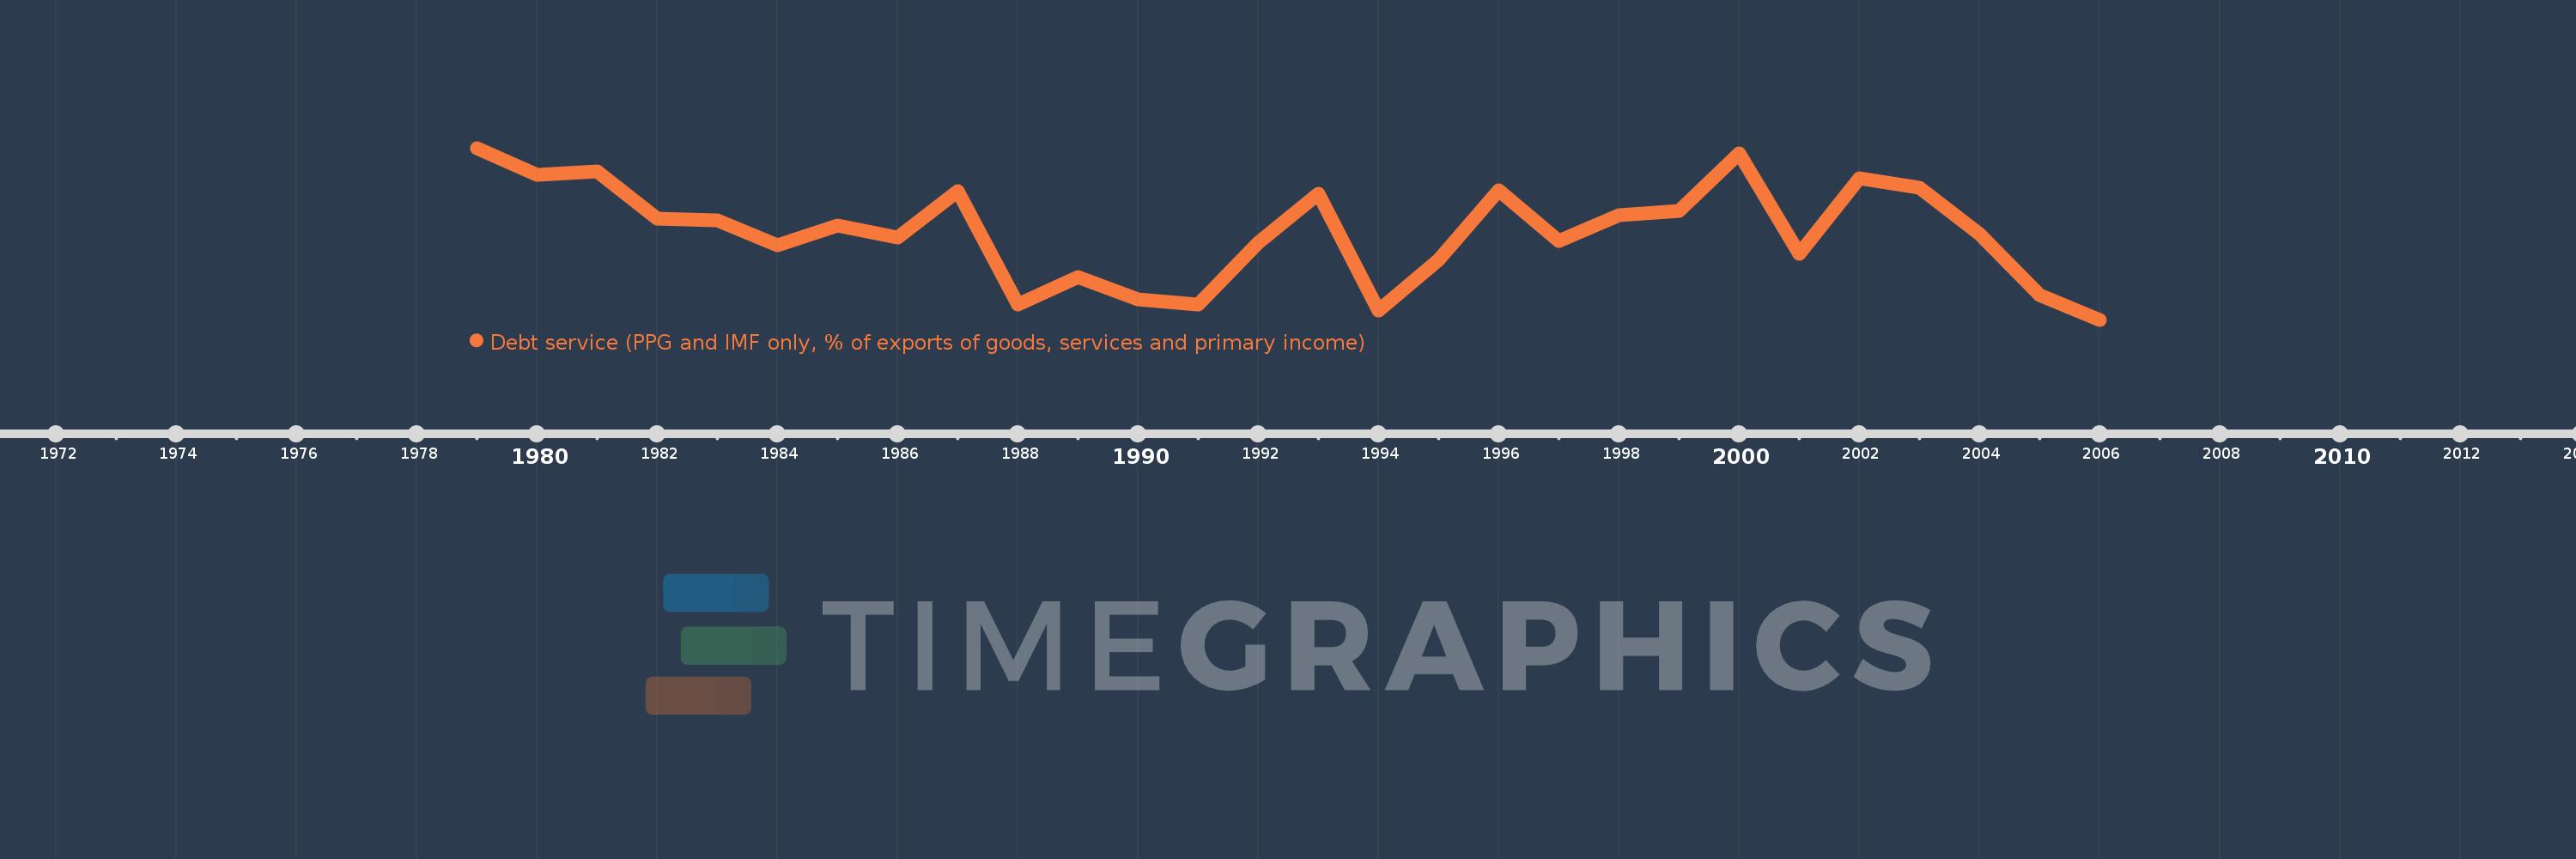
Debt service (PPG and IMF only, % of exports of goods, services and primary income)
2006,2005,2004,2003,2002,2001,2000,1999,1998,1997,1996,1995,1994,1993,1992,1991,1990,1989,1988,1987,1986,1985,1984,1983,1982,1981,1980,1979
This statistics in other country:
Timeline:
This timeline shows a graph from 1979 to 2006 of Gabon. No data until 1978. Number of actual observations by date: 28.
Source name:
World Development Indicators
Source organization:
World Bank, International Debt Statistics.
Categories, topics:
External Debt
Last updated:
apr 23, 2017
Indicators value changes by year
Maximum:
18.446
jan 1, 1979
At the date of observation
Value
Absolute change
Change from previous value
jan 1, 1979
18.446
+18.446
0.0%
jan 1, 1980
16.074
-2.371
-12.86%
jan 1, 1981
16.381
+0.306
1.91%
jan 1, 1982
12.248
-4.132
-25.23%
jan 1, 1983
12.121
-0.127
-1.04%
jan 1, 1984
9.94
-2.18
-17.99%
jan 1, 1985
11.63
+1.689
16.99%
jan 1, 1986
10.604
-1.026
-8.82%
jan 1, 1987
14.658
+4.054
38.23%
jan 1, 1988
4.715
-9.943
-67.83%
jan 1, 1989
7.111
+2.395
50.8%
jan 1, 1990
5.227
-1.884
-26.49%
jan 1, 1991
4.755
-0.472
-9.02%
jan 1, 1992
10.123
+5.368
112.89%
jan 1, 1993
14.426
+4.303
42.51%
jan 1, 1994
4.189
-10.237
-70.96%
jan 1, 1995
8.642
+4.453
106.3%
jan 1, 1996
14.729
+6.087
70.44%
jan 1, 1997
10.324
-4.406
-29.91%
jan 1, 1998
12.563
+2.24
21.7%
jan 1, 1999
12.929
+0.366
2.91%
jan 1, 2000
17.993
+5.064
39.16%
jan 1, 2001
9.213
-8.78
-48.8%
jan 1, 2002
15.81
+6.597
71.61%
jan 1, 2003
14.938
-0.872
-5.51%
jan 1, 2004
10.909
-4.029
-26.97%
jan 1, 2005
5.588
-5.321
-48.77%
jan 1, 2006
3.409
-2.18
-39.01%
Ranking of countries by current statistics by years


Comments: