29
/
en
AIzaSyAYiBZKx7MnpbEhh9jyipgxe19OcubqV5w
April 1, 2024
91892
Brazil
BRA
true
2
1
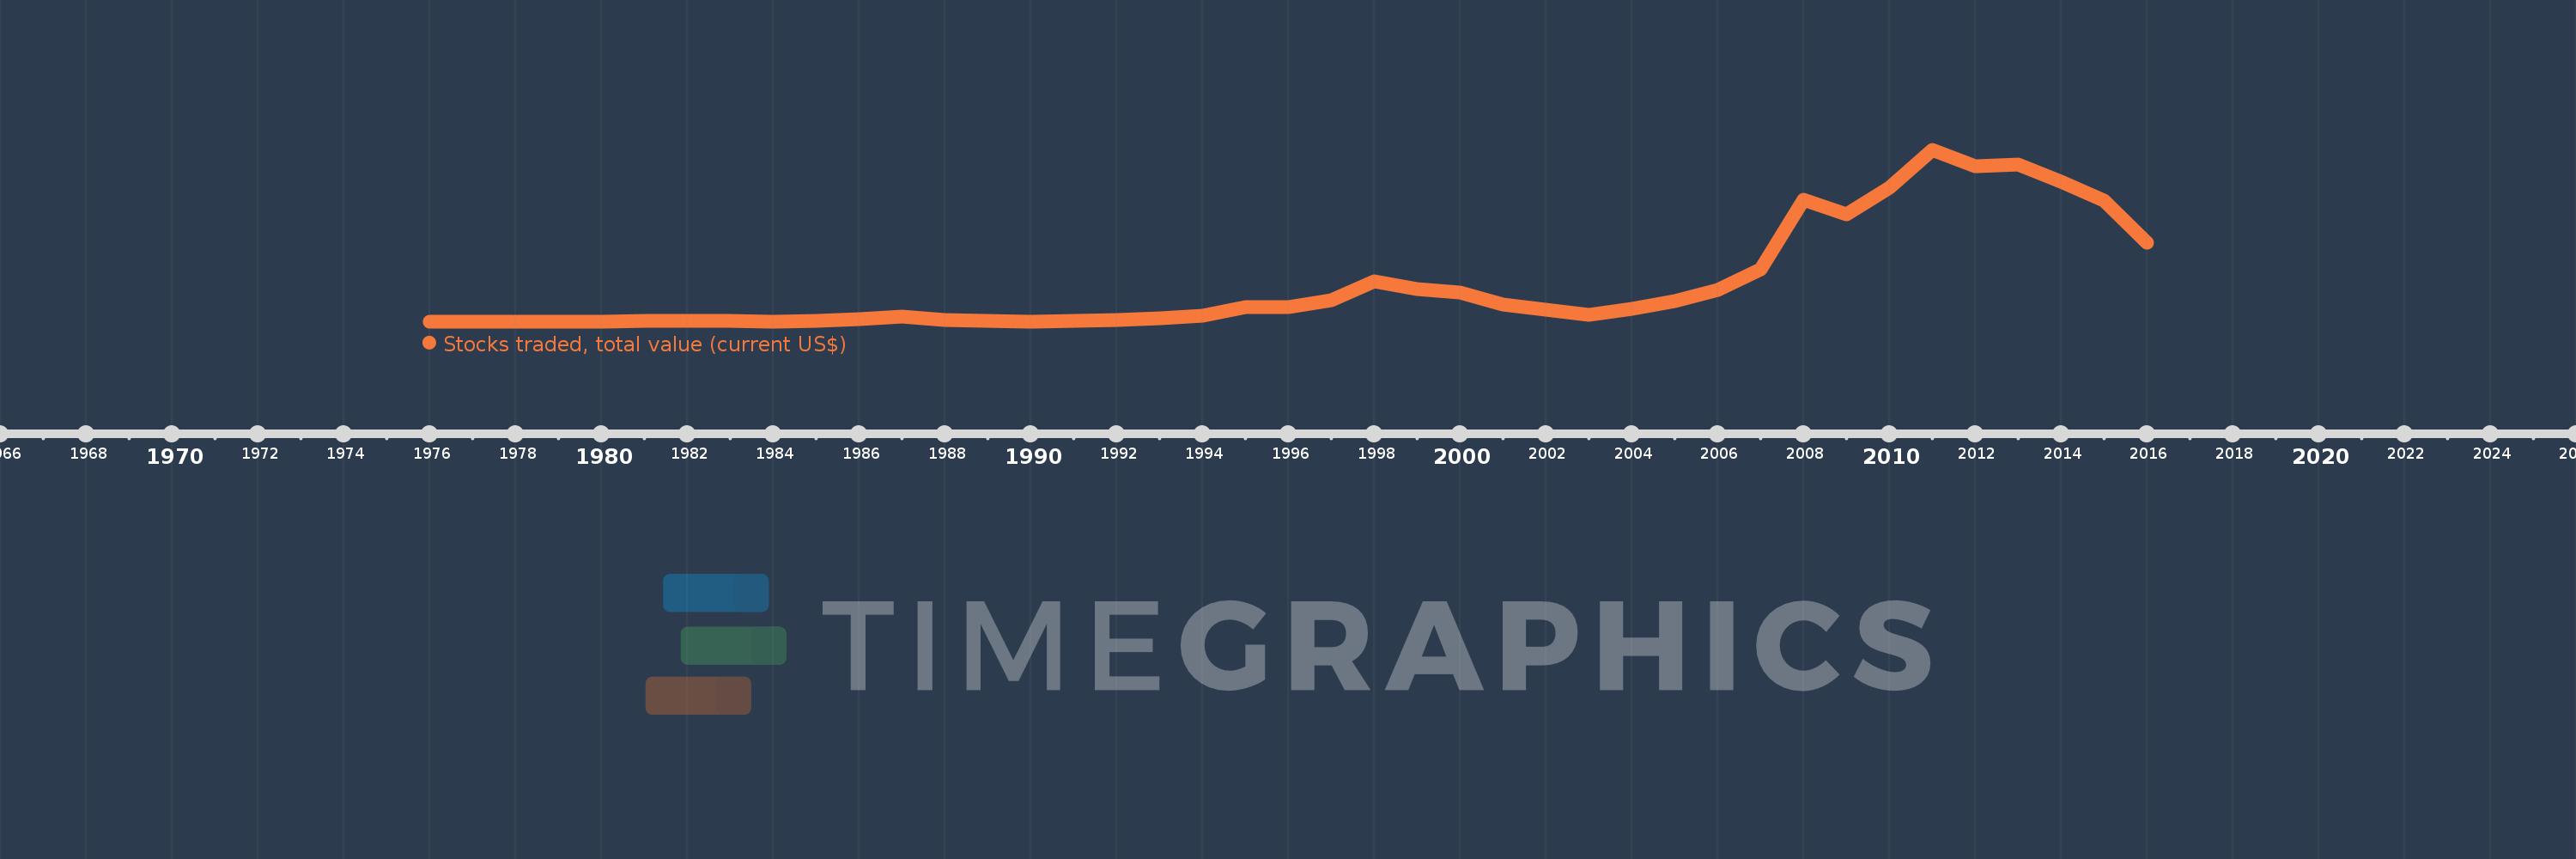
Stocks traded, total value (current US$)
2016,2015,2014,2013,2012,2011,2010,2009,2008,2007,2006,2005,2004,2003,2002,2001,2000,1999,1998,1997,1996,1995,1994,1993,1992,1991,1990,1989,1988,1987,1986,1985,1984,1983,1982,1981,1980,1979,1978,1977,1976
This statistics in other country:
Timeline:
This timeline shows a graph from 1976 to 2016 of Brazil. No data until 1975. Number of actual observations by date: 41.
Source name:
World Development Indicators
Source organization:
World Federation of Exchanges database.
Categories, topics:
Financial Sector
Last updated:
apr 23, 2017
Indicators value changes by year
Minimum:
1.419 bln
jan 1, 1977
Maximum:
908.132 bln
jan 1, 2011
At the date of observation
Value
Absolute change
Change from previous value
jan 1, 1976
1.729 bln
+1.729 bln
0.0%
jan 1, 1977
1.419 bln
-310.0 mln
-17.93%
jan 1, 1978
2.879 bln
+1.46 bln
102.89%
jan 1, 1979
1.419 bln
-1.46 bln
-50.71%
jan 1, 1980
3.243 bln
+1.824 bln
128.57%
jan 1, 1981
5.376 bln
+2.132 bln
65.74%
jan 1, 1982
6.184 bln
+808.2 mln
15.03%
jan 1, 1983
5.925 bln
-258.5 mln
-4.18%
jan 1, 1984
3.509 bln
-2.417 bln
-40.79%
jan 1, 1985
7.414 bln
+3.905 bln
111.29%
jan 1, 1986
16.58 bln
+9.166 bln
123.64%
jan 1, 1987
28.91 bln
+12.33 bln
74.37%
jan 1, 1988
9.827 bln
-19.083 bln
-66.01%
jan 1, 1989
6.1 bln
-3.727 bln
-37.92%
jan 1, 1990
4.153 bln
-1.947 bln
-31.92%
jan 1, 1991
5.843 bln
+1.69 bln
40.7%
jan 1, 1992
11.768 bln
+5.925 bln
101.4%
jan 1, 1993
23.062 bln
+11.295 bln
95.98%
jan 1, 1994
35.188 bln
+12.126 bln
52.58%
jan 1, 1995
81.758 bln
+46.57 bln
132.35%
jan 1, 1996
78.903 bln
-2.856 bln
-3.49%
jan 1, 1997
116.128 bln
+37.226 bln
47.18%
jan 1, 1998
217.399 bln
+101.271 bln
87.21%
jan 1, 1999
172.862 bln
-44.537 bln
-20.49%
jan 1, 2000
158.85 bln
-14.012 bln
-8.11%
jan 1, 2001
94.051 bln
-64.799 bln
-40.79%
jan 1, 2002
64.477 bln
-29.574 bln
-31.44%
jan 1, 2003
39.375 bln
-25.102 bln
-38.93%
jan 1, 2004
70.479 bln
+31.104 bln
79.0%
jan 1, 2005
113.682 bln
+43.204 bln
61.3%
jan 1, 2006
170.92 bln
+57.238 bln
50.35%
jan 1, 2007
279.477 bln
+108.557 bln
63.51%
jan 1, 2008
645.439 bln
+365.962 bln
130.95%
jan 1, 2009
569.862 bln
-75.576 bln
-11.71%
jan 1, 2010
707.867 bln
+138.004 bln
24.22%
jan 1, 2011
908.132 bln
+200.265 bln
28.29%
jan 1, 2012
824.916 bln
-83.215 bln
-9.16%
jan 1, 2013
831.639 bln
+6.722 bln
0.81%
jan 1, 2014
739.678 bln
-91.961 bln
-11.06%
jan 1, 2015
644.171 bln
-95.507 bln
-12.91%
jan 1, 2016
419.978 bln
-224.194 bln
-34.8%
Ranking of countries by current statistics by years


Comments: