29
/
en
AIzaSyAYiBZKx7MnpbEhh9jyipgxe19OcubqV5w
April 1, 2024
129900
Estonia
EST
true
2
1
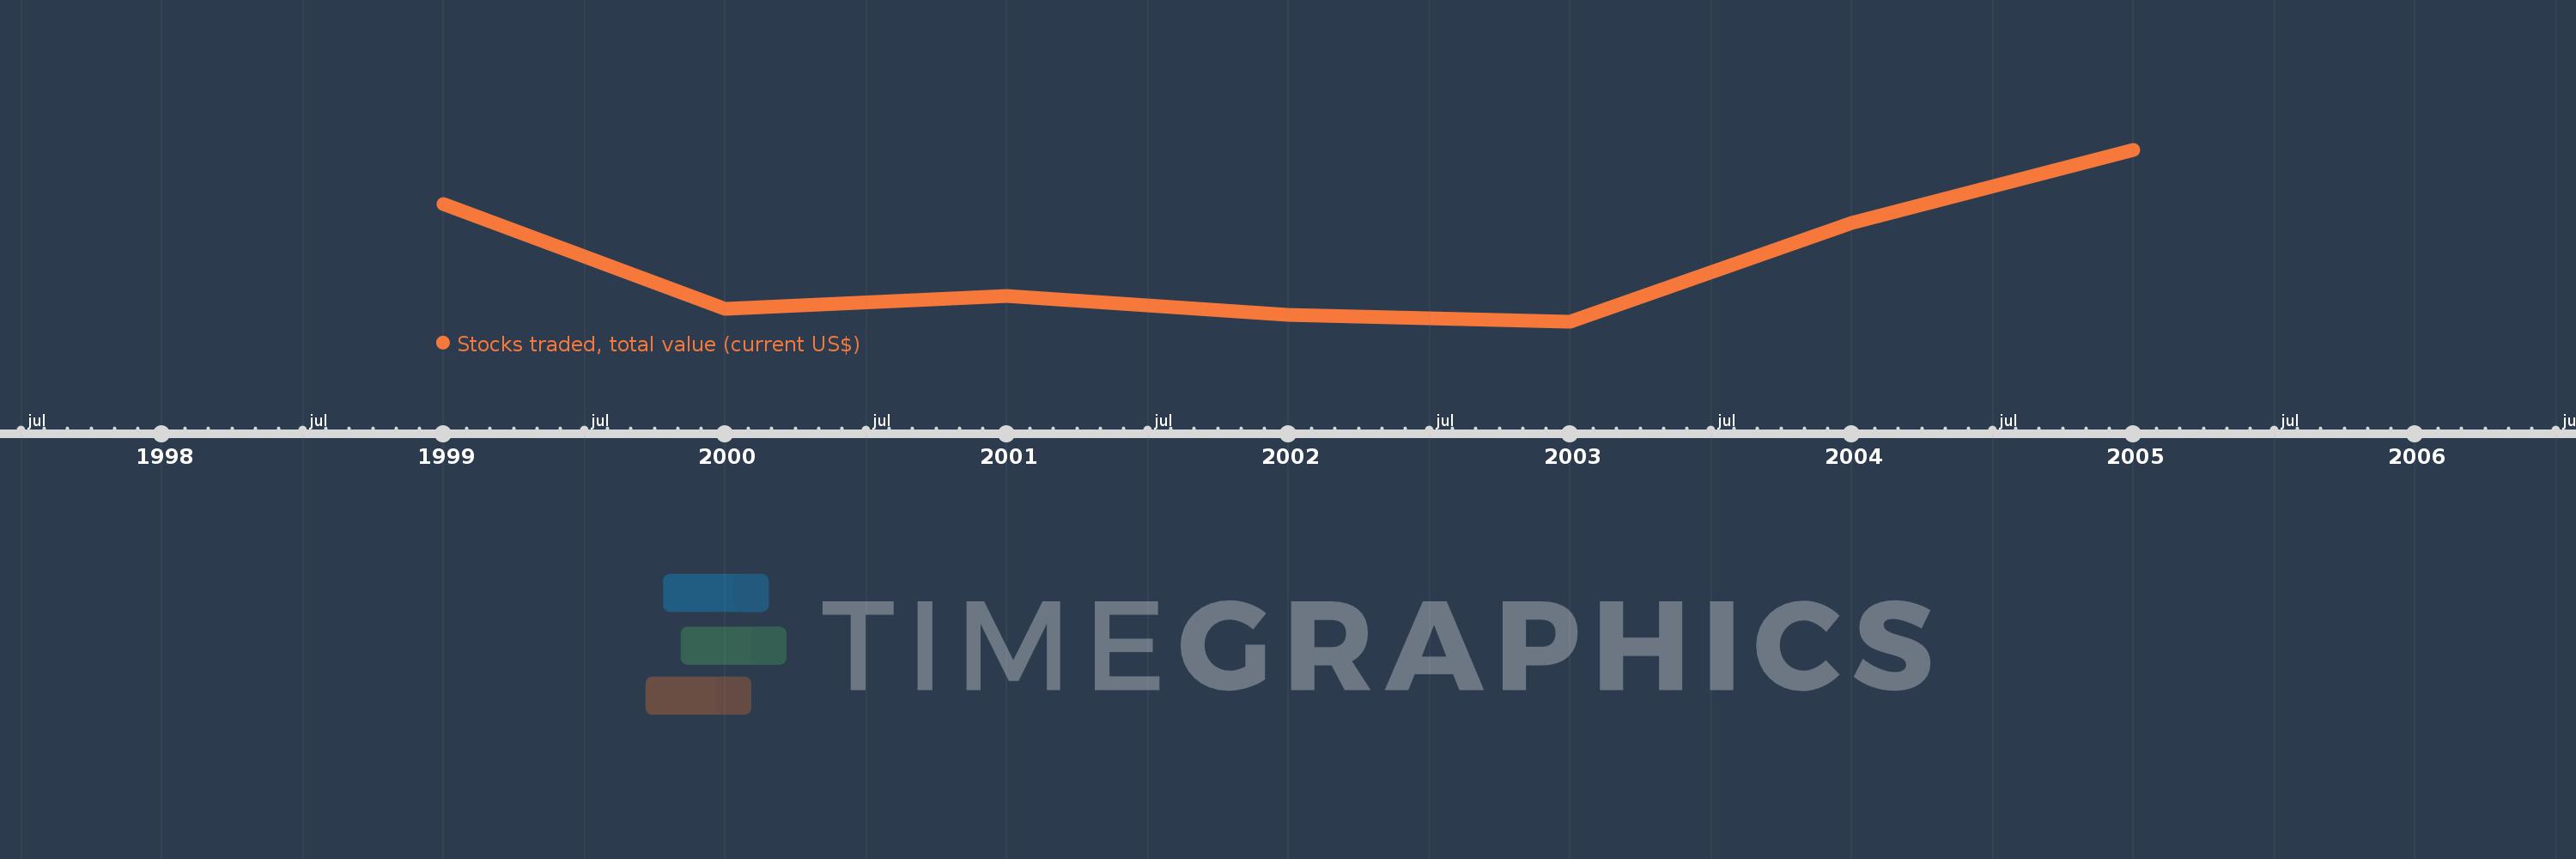
Stocks traded, total value (current US$)
2005,2004,2003,2002,2001,2000,1999
This statistics in other country:
Timeline:
This timeline shows a graph from 1999 to 2005 of Estonia. No data until 1998. Number of actual observations by date: 7.
Source name:
World Development Indicators
Source organization:
World Federation of Exchanges database.
Categories, topics:
Financial Sector
Last updated:
apr 23, 2017
Indicators value changes by year
Minimum:
230.6 mln
jan 1, 2003
Maximum:
899.2 mln
jan 1, 2005
At the date of observation
Value
Absolute change
Change from previous value
jan 1, 1999
691.0 mln
+691.0 mln
0.0%
jan 1, 2000
280.4 mln
-410.6 mln
-59.42%
jan 1, 2001
332.1 mln
+51.7 mln
18.44%
jan 1, 2002
258.3 mln
-73.8 mln
-22.22%
jan 1, 2003
230.6 mln
-27.7 mln
-10.72%
jan 1, 2004
615.2 mln
+384.6 mln
166.78%
jan 1, 2005
899.2 mln
+284.0 mln
46.16%
Ranking of countries by current statistics by years


Comments: