29
/
en
AIzaSyAYiBZKx7MnpbEhh9jyipgxe19OcubqV5w
April 1, 2024
142348
Greece
GRC
true
2
1
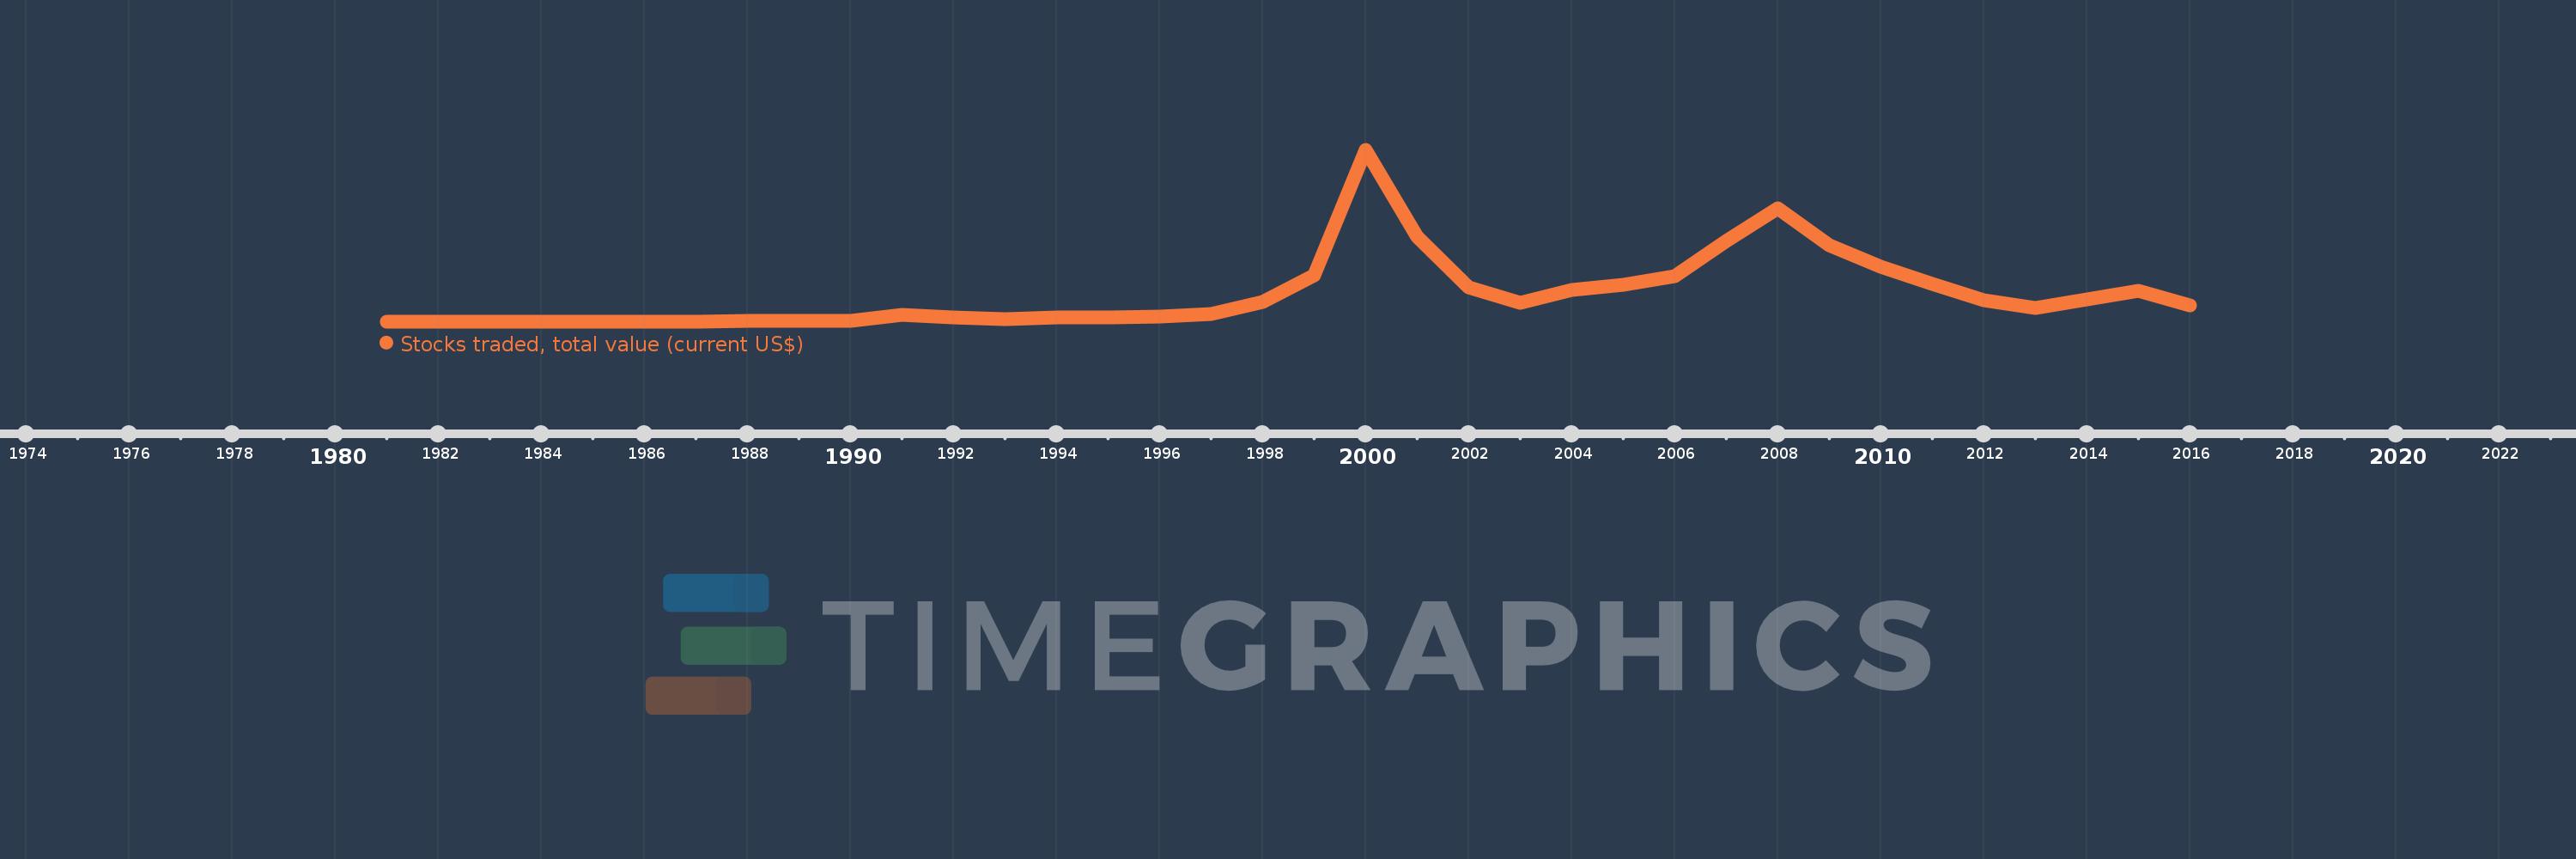
Stocks traded, total value (current US$)
2016,2015,2014,2013,2012,2011,2010,2009,2008,2007,2006,2005,2004,2003,2002,2001,2000,1999,1998,1997,1996,1995,1994,1993,1992,1991,1990,1989,1988,1987,1986,1985,1984,1983,1982,1981
This statistics in other country:
Timeline:
This timeline shows a graph from 1981 to 2016 of Greece. No data until 1980. Number of actual observations by date: 36.
Source name:
World Development Indicators
Source organization:
World Federation of Exchanges database.
Categories, topics:
Financial Sector
Last updated:
apr 23, 2017
Indicators value changes by year
Minimum:
48.0 mln
jan 1, 1985
Maximum:
183.895 bln
jan 1, 2000
At the date of observation
Value
Absolute change
Change from previous value
jan 1, 1981
291.0 mln
+291.0 mln
0.0%
jan 1, 1982
189.0 mln
-102.0 mln
-35.05%
jan 1, 1983
132.0 mln
-57.0 mln
-30.16%
jan 1, 1984
64.0 mln
-68.0 mln
-51.52%
jan 1, 1985
48.0 mln
-16.0 mln
-25.0%
jan 1, 1986
71.0 mln
+23.0 mln
47.92%
jan 1, 1987
107.0 mln
+36.0 mln
50.7%
jan 1, 1988
1.202 bln
+1.095 bln
1.02K%
jan 1, 1989
832.0 mln
-370.0 mln
-30.78%
jan 1, 1990
1.429 bln
+597.0 mln
71.75%
jan 1, 1991
7.977 bln
+6.548 bln
458.22%
jan 1, 1992
4.785 bln
-3.192 bln
-40.02%
jan 1, 1993
2.755 bln
-2.03 bln
-42.42%
jan 1, 1994
5.037 bln
+2.282 bln
82.83%
jan 1, 1995
5.008 bln
-28.5 mln
-0.57%
jan 1, 1996
5.95 bln
+941.6 mln
18.8%
jan 1, 1997
8.234 bln
+2.284 bln
38.39%
jan 1, 1998
21.137 bln
+12.902 bln
156.69%
jan 1, 1999
50.02 bln
+28.883 bln
136.65%
jan 1, 2000
183.895 bln
+133.875 bln
267.65%
jan 1, 2001
91.62 bln
-92.275 bln
-50.18%
jan 1, 2002
37.13 bln
-54.49 bln
-59.47%
jan 1, 2003
20.449 bln
-16.681 bln
-44.93%
jan 1, 2004
33.878 bln
+13.429 bln
65.67%
jan 1, 2005
39.892 bln
+6.015 bln
17.75%
jan 1, 2006
49.162 bln
+9.269 bln
23.24%
jan 1, 2007
86.545 bln
+37.384 bln
76.04%
jan 1, 2008
121.524 bln
+34.978 bln
40.42%
jan 1, 2009
81.801 bln
-39.722 bln
-32.69%
jan 1, 2010
59.313 bln
-22.488 bln
-27.49%
jan 1, 2011
40.643 bln
-18.67 bln
-31.48%
jan 1, 2012
22.979 bln
-17.664 bln
-43.46%
jan 1, 2013
15.077 bln
-7.901 bln
-34.39%
jan 1, 2014
24.011 bln
+8.933 bln
59.25%
jan 1, 2015
33.05 bln
+9.04 bln
37.65%
jan 1, 2016
17.943 bln
-15.108 bln
-45.71%
Ranking of countries by current statistics by years


Comments: