29
/
en
AIzaSyAYiBZKx7MnpbEhh9jyipgxe19OcubqV5w
April 1, 2024
47750
Lower middle income
LMC
false
2
1
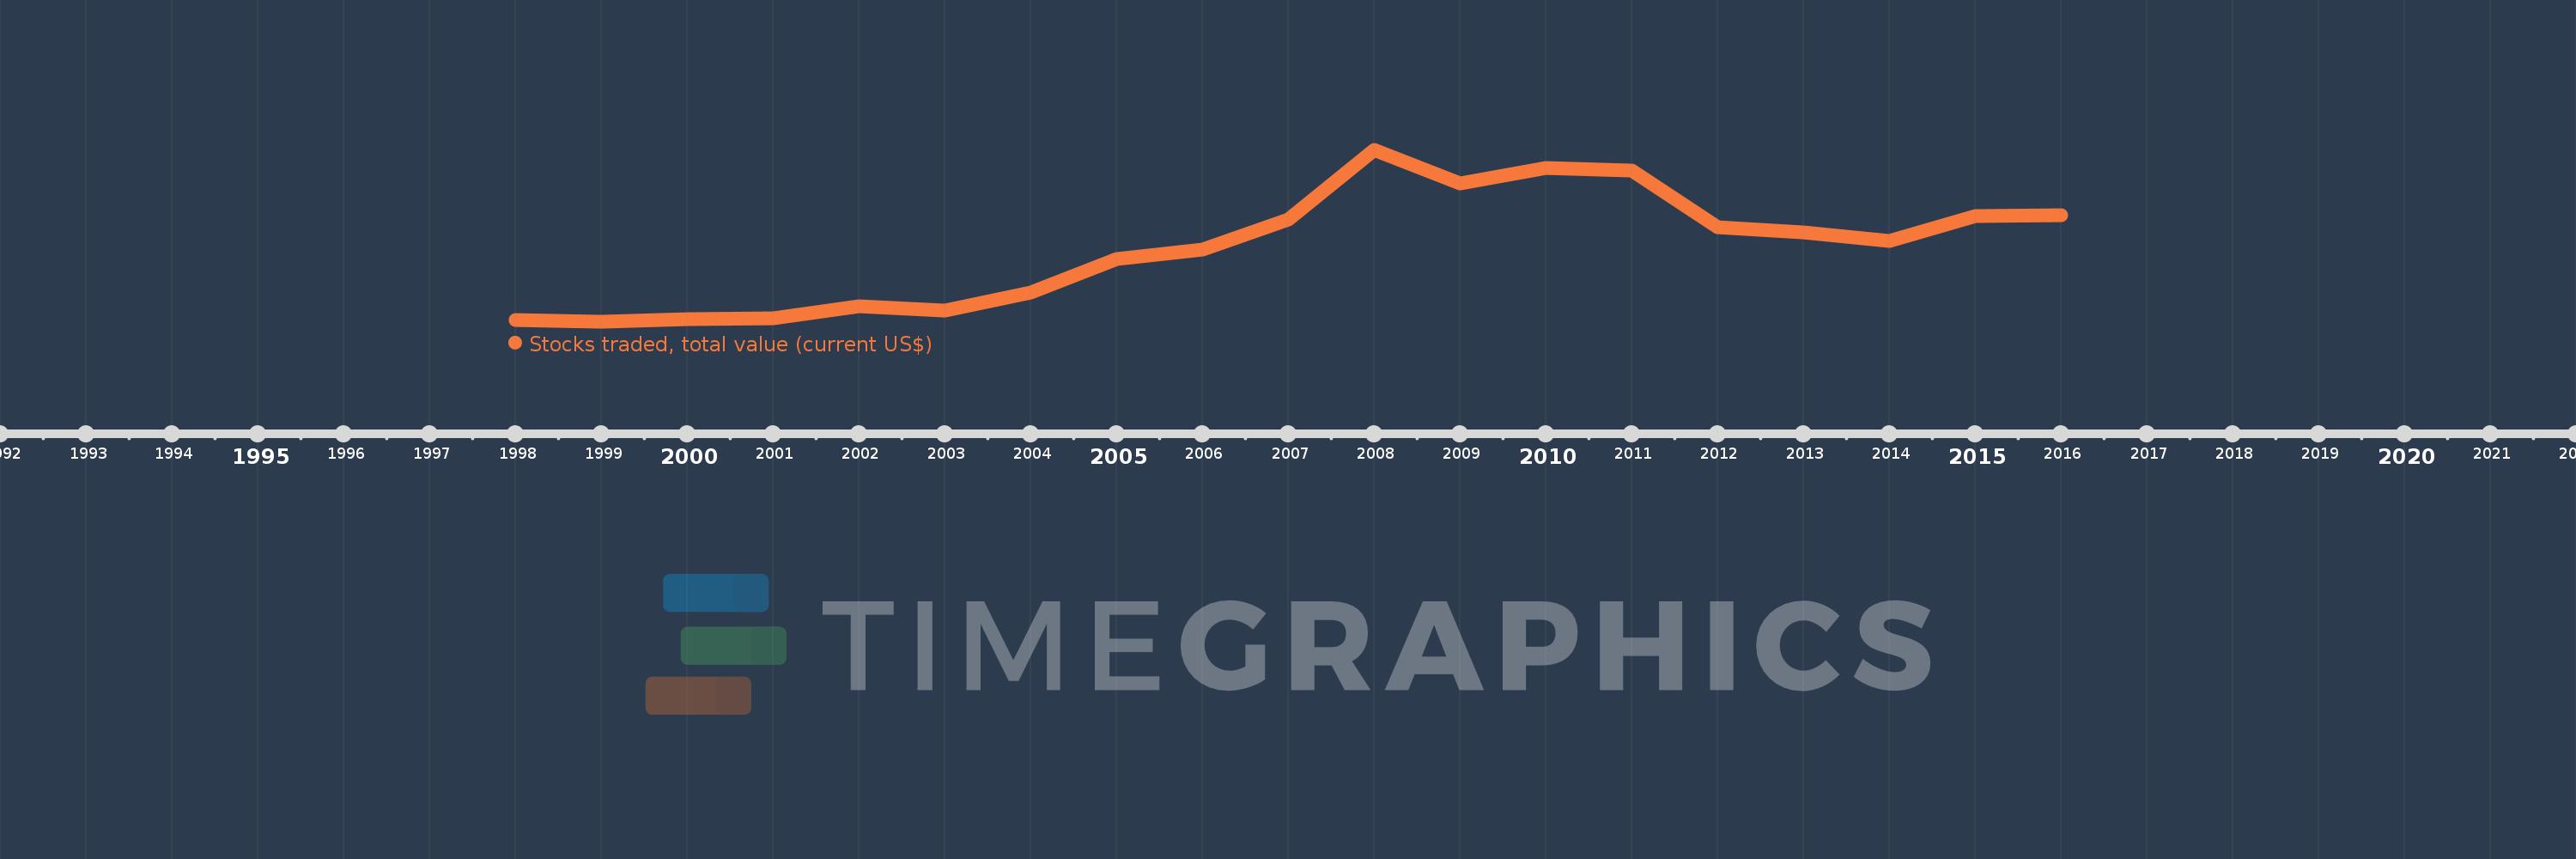
Stocks traded, total value (current US$)
2016,2015,2014,2013,2012,2011,2010,2009,2008,2007,2006,2005,2004,2003,2002,2001,2000,1999,1998
This statistics in other country:
Timeline:
This timeline shows a graph from 1998 to 2016 of Lower middle income. No data until 1997. Number of actual observations by date: 19.
Source name:
World Development Indicators
Source organization:
World Federation of Exchanges database.
Categories, topics:
Financial Sector
Last updated:
apr 23, 2017
Indicators value changes by year
Minimum:
46.886 bln
jan 1, 1999
Maximum:
1.469 trl
jan 1, 2008
At the date of observation
Value
Absolute change
Change from previous value
jan 1, 1998
65.518 bln
+65.518 bln
0.0%
jan 1, 1999
46.886 bln
-18.632 bln
-28.44%
jan 1, 2000
71.407 bln
+24.521 bln
52.3%
jan 1, 2001
77.84 bln
+6.433 bln
9.01%
jan 1, 2002
179.478 bln
+101.638 bln
130.57%
jan 1, 2003
144.541 bln
-34.937 bln
-19.47%
jan 1, 2004
290.94 bln
+146.399 bln
101.29%
jan 1, 2005
565.773 bln
+274.833 bln
94.46%
jan 1, 2006
649.345 bln
+83.572 bln
14.77%
jan 1, 2007
891.486 bln
+242.142 bln
37.29%
jan 1, 2008
1.469 trl
+577.122 bln
64.74%
jan 1, 2009
1.194 trl
-274.12 bln
-18.67%
jan 1, 2010
1.323 trl
+128.177 bln
10.73%
jan 1, 2011
1.303 trl
-19.5 bln
-1.47%
jan 1, 2012
830.436 bln
-472.73 bln
-36.28%
jan 1, 2013
786.95 bln
-43.486 bln
-5.24%
jan 1, 2014
720.562 bln
-66.388 bln
-8.44%
jan 1, 2015
924.956 bln
+204.394 bln
28.37%
jan 1, 2016
928.525 bln
+3.569 bln
0.39%
Ranking of countries by current statistics by years


Comments: