29
/
en
AIzaSyAYiBZKx7MnpbEhh9jyipgxe19OcubqV5w
April 1, 2024
37020
IBRD only
IBD
false
2
1
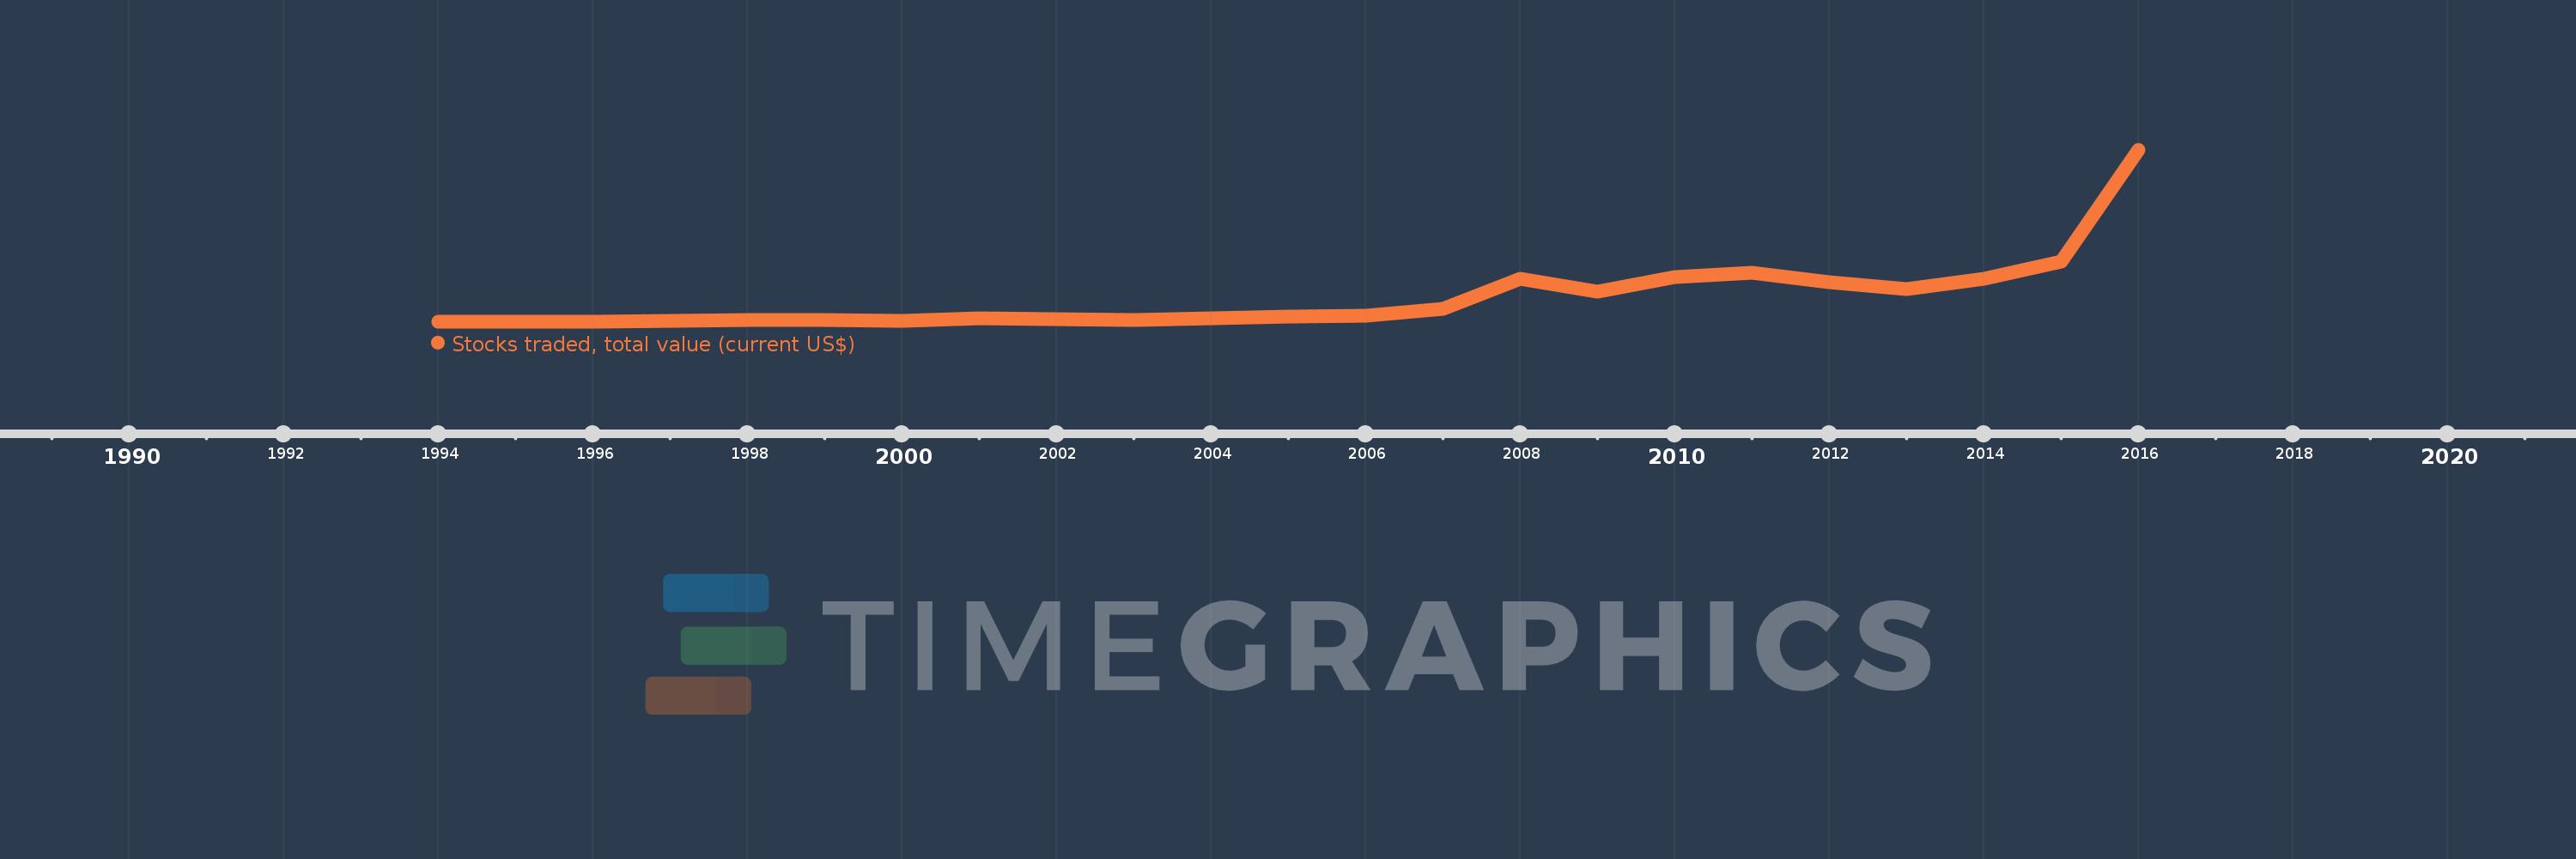
Stocks traded, total value (current US$)
2016,2015,2014,2013,2012,2011,2010,2009,2008,2007,2006,2005,2004,2003,2002,2001,2000,1999,1998,1997,1996,1995,1994
This statistics in other country:
Timeline:
This timeline shows a graph from 1994 to 2016 of IBRD only. No data until 1993. Number of actual observations by date: 23.
Source name:
World Development Indicators
Source organization:
World Federation of Exchanges database.
Categories, topics:
Financial Sector
Last updated:
apr 23, 2017
Indicators value changes by year
Minimum:
339.424 bln
jan 1, 1994
Maximum:
41.94 trl
jan 1, 2016
At the date of observation
Value
Absolute change
Change from previous value
jan 1, 1994
339.424 bln
+339.424 bln
0.0%
jan 1, 1995
493.458 bln
+154.034 bln
45.38%
jan 1, 1996
461.642 bln
-31.817 bln
-6.45%
jan 1, 1997
671.006 bln
+209.365 bln
45.35%
jan 1, 1998
905.602 bln
+234.595 bln
34.96%
jan 1, 1999
731.06 bln
-174.542 bln
-19.27%
jan 1, 2000
704.851 bln
-26.208 bln
-3.58%
jan 1, 2001
1.292 trl
+587.044 bln
83.29%
jan 1, 2002
955.001 bln
-336.895 bln
-26.08%
jan 1, 2003
790.7 bln
-164.3 bln
-17.2%
jan 1, 2004
1.177 trl
+386.421 bln
48.87%
jan 1, 2005
1.671 trl
+493.747 bln
41.95%
jan 1, 2006
1.816 trl
+145.606 bln
8.71%
jan 1, 2007
3.57 trl
+1.753 trl
96.52%
jan 1, 2008
10.763 trl
+7.193 trl
201.51%
jan 1, 2009
7.611 trl
-3.152 trl
-29.28%
jan 1, 2010
11.296 trl
+3.684 trl
48.41%
jan 1, 2011
12.246 trl
+950.394 bln
8.41%
jan 1, 2012
10.069 trl
-2.177 trl
-17.78%
jan 1, 2013
8.203 trl
-1.866 trl
-18.53%
jan 1, 2014
10.823 trl
+2.619 trl
31.93%
jan 1, 2015
14.994 trl
+4.171 trl
38.54%
jan 1, 2016
41.94 trl
+26.946 trl
179.71%
Ranking of countries by current statistics by years


Comments: