29
/
en
AIzaSyAYiBZKx7MnpbEhh9jyipgxe19OcubqV5w
April 1, 2024
61206
Sub-Saharan Africa (IDA & IBRD countries)
TSS
false
2
1
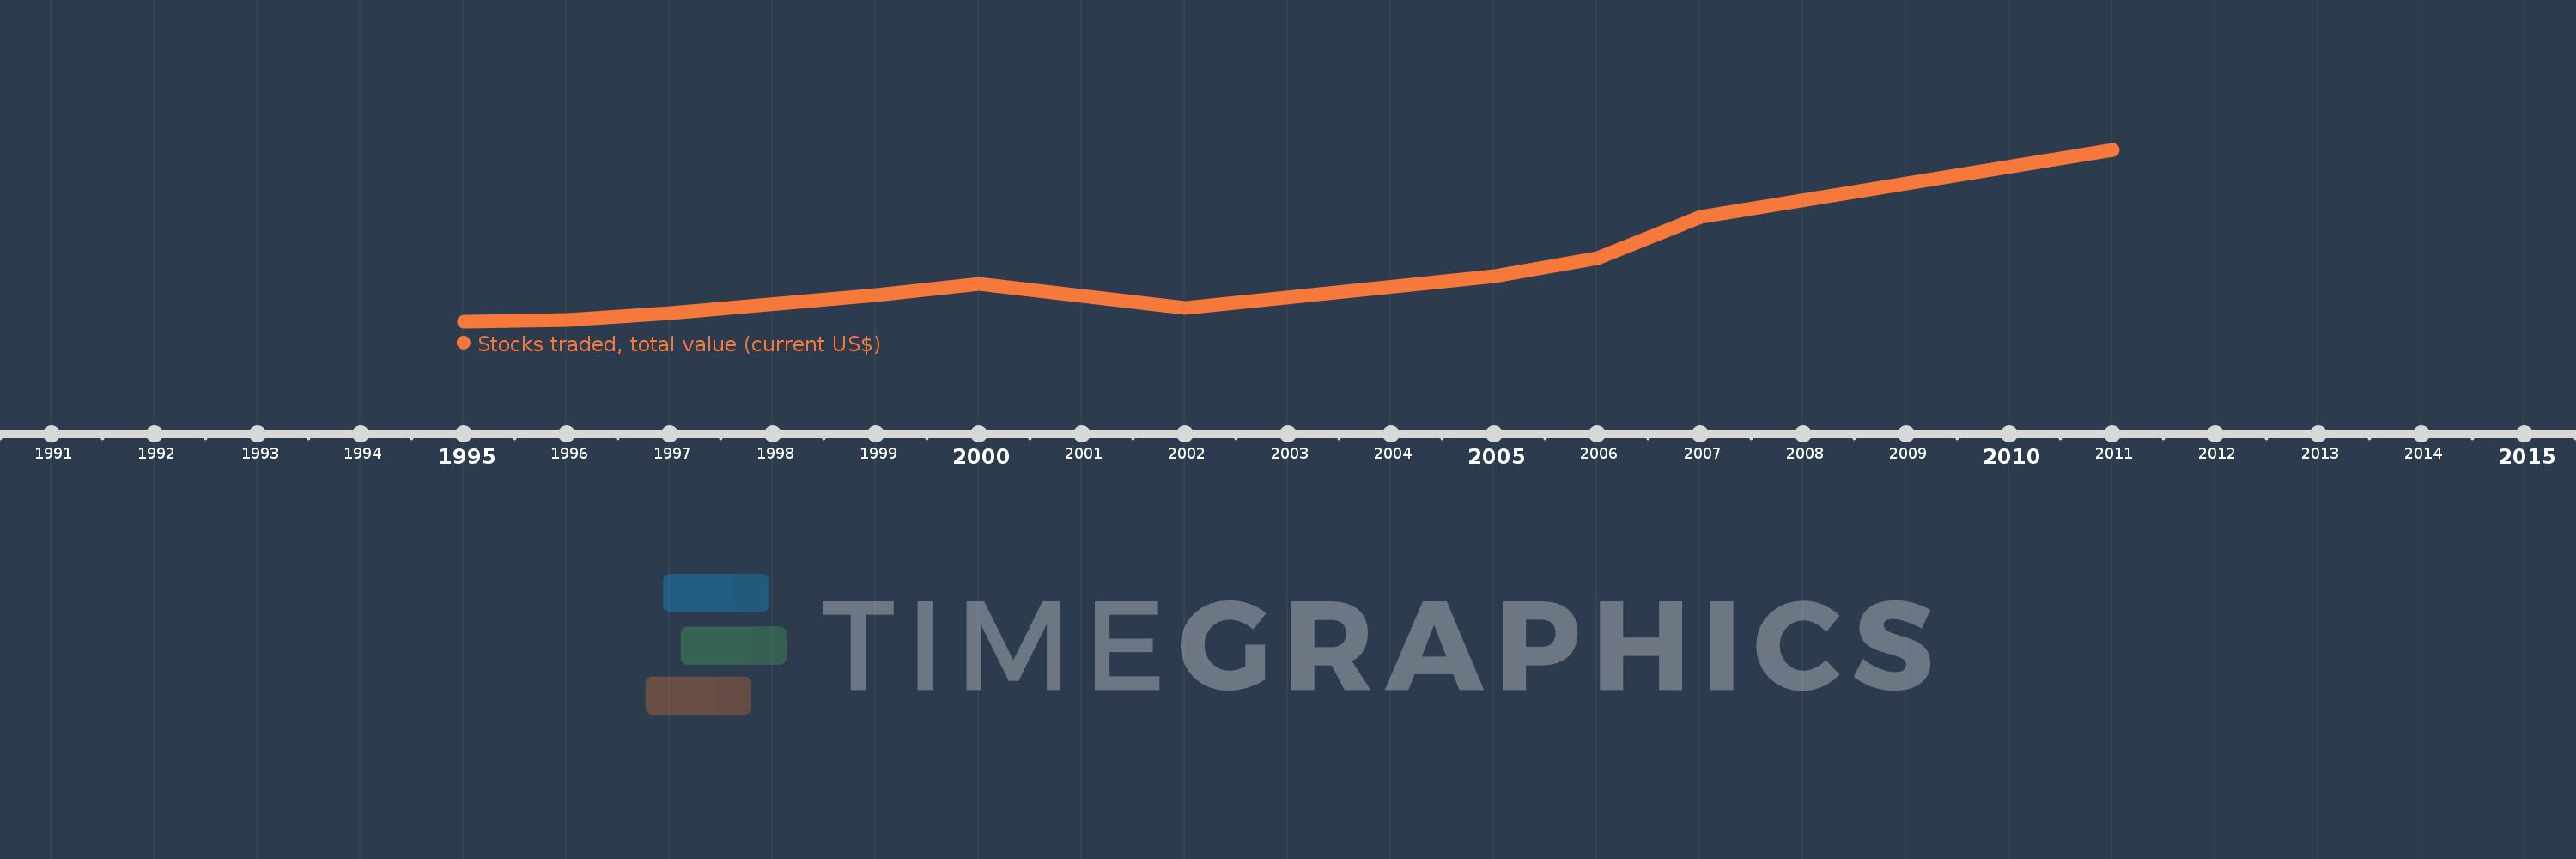
Stocks traded, total value (current US$)
2011,2007,2006,2005,2002,2000,1999,1997,1996,1995
This statistics in other country:
Timeline:
This timeline shows a graph from 1995 to 2011 of Sub-Saharan Africa (IDA & IBRD countries). No data until 1994. Number of actual observations by date: 10.
Source name:
World Development Indicators
Source organization:
World Federation of Exchanges database.
Categories, topics:
Financial Sector
Last updated:
apr 23, 2017
Indicators value changes by year
Minimum:
13.852 bln
jan 1, 1995
Maximum:
283.887 bln
jan 1, 2011
At the date of observation
Value
Absolute change
Change from previous value
jan 1, 1995
13.852 bln
+13.852 bln
0.0%
jan 1, 1996
16.359 bln
+2.507 bln
18.1%
jan 1, 1997
27.842 bln
+11.483 bln
70.19%
jan 1, 1999
55.499 bln
+27.658 bln
99.34%
jan 1, 2000
73.412 bln
+17.913 bln
32.28%
jan 1, 2002
35.723 bln
-37.689 bln
-51.34%
jan 1, 2005
85.998 bln
+50.275 bln
140.73%
jan 1, 2006
114.024 bln
+28.026 bln
32.59%
jan 1, 2007
179.067 bln
+65.042 bln
57.04%
jan 1, 2011
283.887 bln
+104.82 bln
58.54%
Ranking of countries by current statistics by years


Comments: