29
/
en
AIzaSyAYiBZKx7MnpbEhh9jyipgxe19OcubqV5w
April 1, 2024
235165
Saudi Arabia
SAU
true
2
1
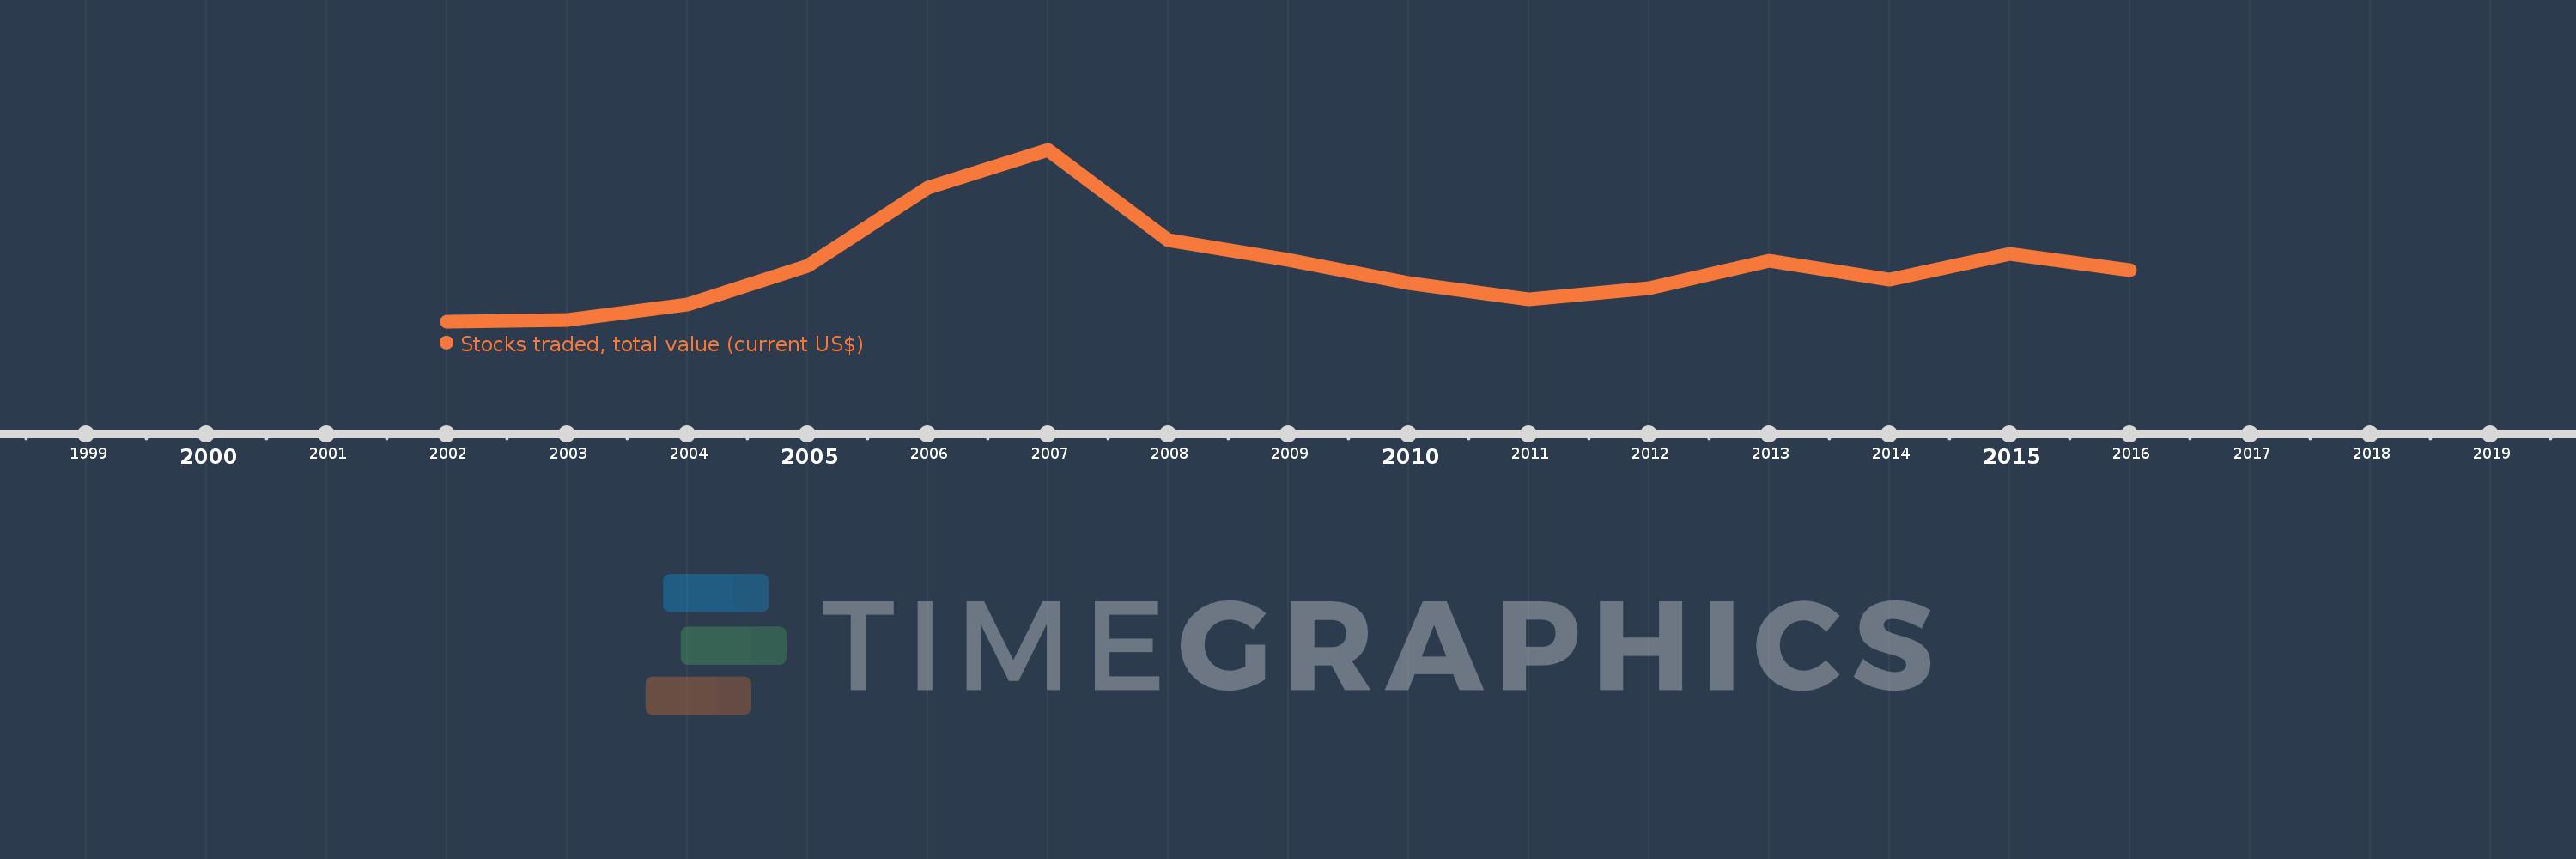
Stocks traded, total value (current US$)
2016,2015,2014,2013,2012,2011,2010,2009,2008,2007,2006,2005,2004,2003,2002
This statistics in other country:
Timeline:
This timeline shows a graph from 2002 to 2016 of Saudi Arabia. No data until 2001. Number of actual observations by date: 15.
Source name:
World Development Indicators
Source organization:
World Federation of Exchanges database.
Categories, topics:
Financial Sector
Last updated:
apr 23, 2017
Indicators value changes by year
Minimum:
22.291 bln
jan 1, 2002
Maximum:
1.403 trl
jan 1, 2007
At the date of observation
Value
Absolute change
Change from previous value
jan 1, 2002
22.291 bln
+22.291 bln
0.0%
jan 1, 2003
35.678 bln
+13.387 bln
60.06%
jan 1, 2004
159.057 bln
+123.379 bln
345.81%
jan 1, 2005
472.941 bln
+313.884 bln
197.34%
jan 1, 2006
1.104 trl
+630.594 bln
133.33%
jan 1, 2007
1.403 trl
+299.514 bln
27.14%
jan 1, 2008
681.948 bln
-721.101 bln
-51.4%
jan 1, 2009
523.327 bln
-158.621 bln
-23.26%
jan 1, 2010
335.11 bln
-188.217 bln
-35.97%
jan 1, 2011
201.211 bln
-133.899 bln
-39.96%
jan 1, 2012
291.436 bln
+90.225 bln
44.84%
jan 1, 2013
511.178 bln
+219.742 bln
75.4%
jan 1, 2014
362.402 bln
-148.776 bln
-29.1%
jan 1, 2015
567.392 bln
+204.99 bln
56.56%
jan 1, 2016
436.941 bln
-130.451 bln
-22.99%
Ranking of countries by current statistics by years


Comments: