29
/
en
AIzaSyAYiBZKx7MnpbEhh9jyipgxe19OcubqV5w
April 1, 2024
170517
Korea, Rep.
KOR
true
2
1
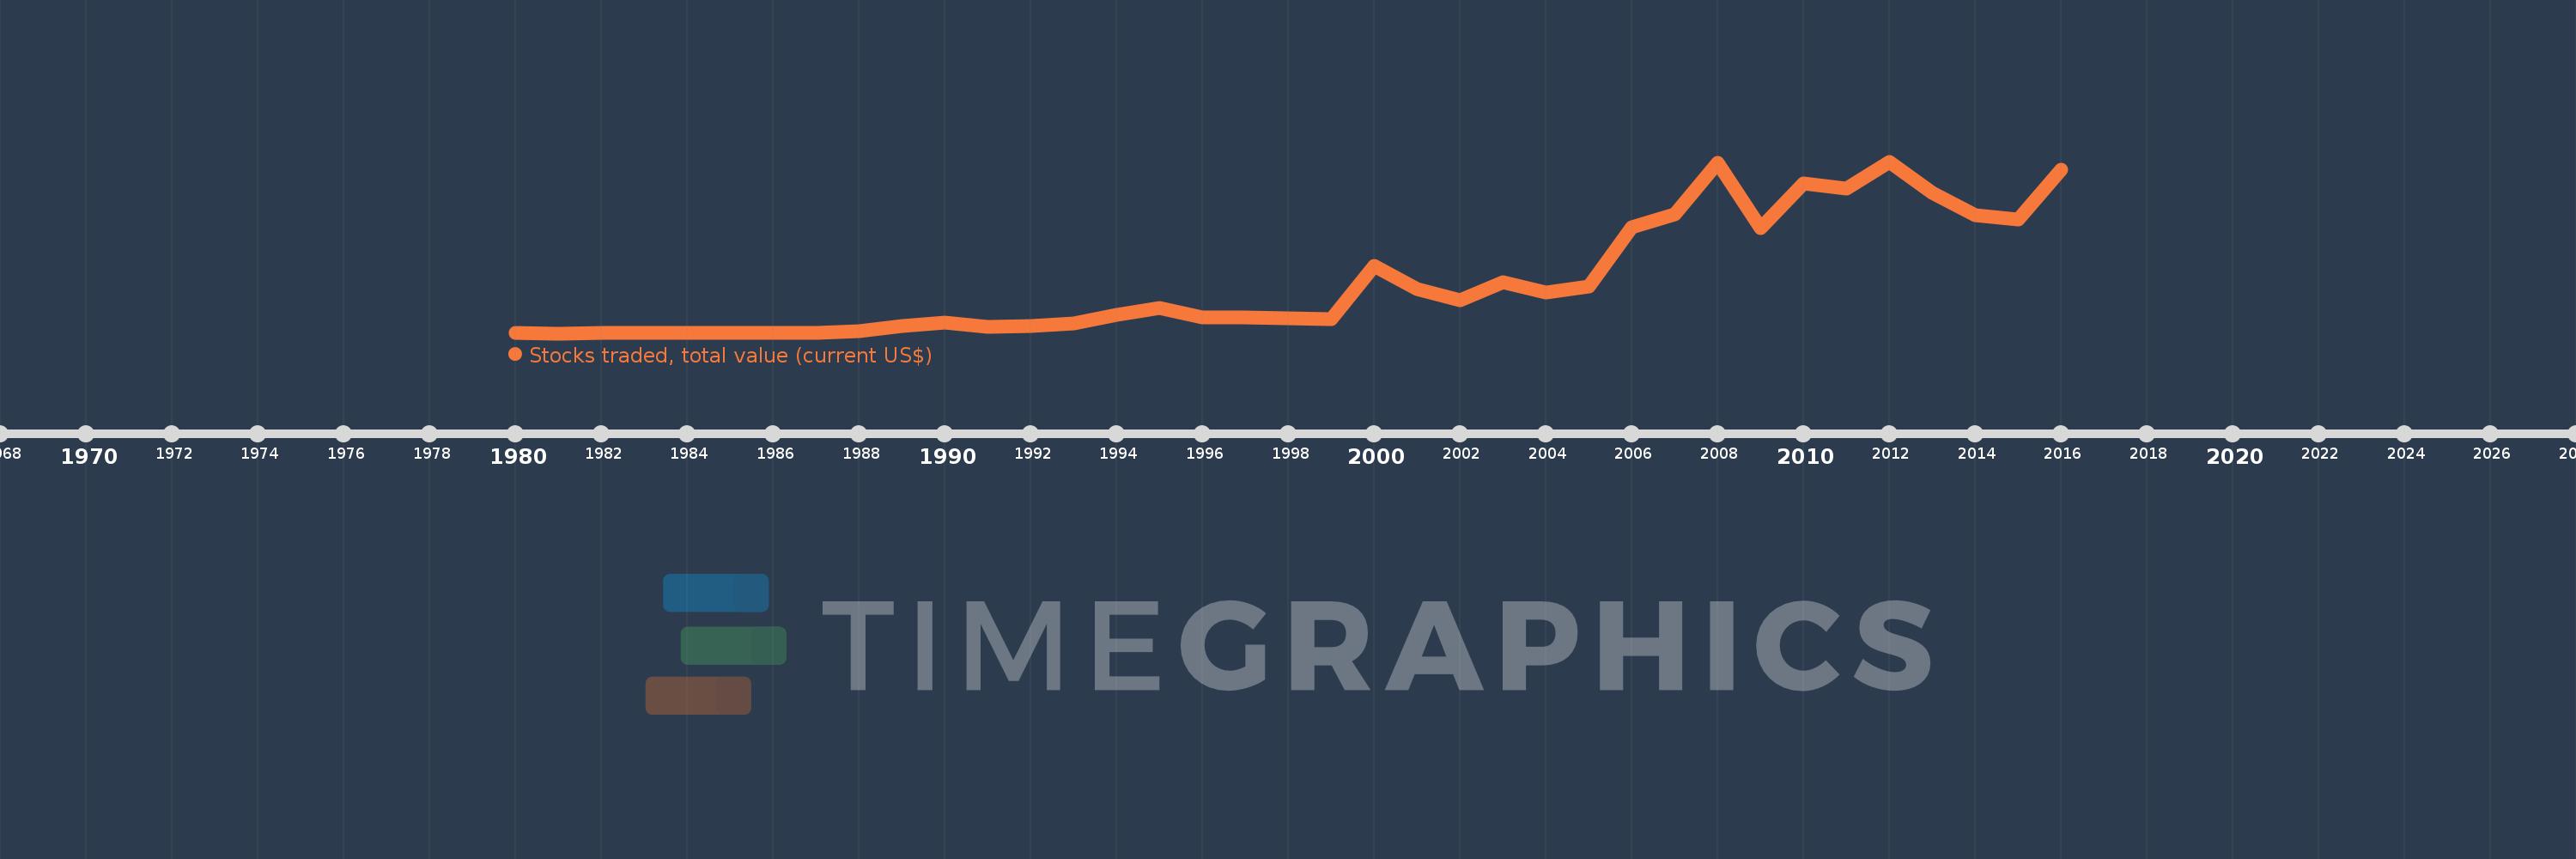
Stocks traded, total value (current US$)
2016,2015,2014,2013,2012,2011,2010,2009,2008,2007,2006,2005,2004,2003,2002,2001,2000,1999,1998,1997,1996,1995,1994,1993,1992,1991,1990,1989,1988,1987,1986,1985,1984,1983,1982,1981,1980
This statistics in other country:
Timeline:
This timeline shows a graph from 1980 to 2016 of Korea, Rep.. No data until 1979. Number of actual observations by date: 37.
Source name:
World Development Indicators
Source organization:
World Federation of Exchanges database.
Categories, topics:
Financial Sector
Last updated:
apr 23, 2017
Indicators value changes by year
Minimum:
1.866 bln
jan 1, 1981
Maximum:
1.934 trl
jan 1, 2012
At the date of observation
Value
Absolute change
Change from previous value
jan 1, 1980
2.7 bln
+2.7 bln
0.0%
jan 1, 1981
1.866 bln
-833.7 mln
-30.88%
jan 1, 1982
3.618 bln
+1.751 bln
93.84%
jan 1, 1983
2.636 bln
-982.15 mln
-27.15%
jan 1, 1984
2.203 bln
-432.41 mln
-16.41%
jan 1, 1985
3.769 bln
+1.565 bln
71.06%
jan 1, 1986
4.067 bln
+298.55 mln
7.92%
jan 1, 1987
11.142 bln
+7.075 bln
173.96%
jan 1, 1988
25.866 bln
+14.724 bln
132.14%
jan 1, 1989
84.959 bln
+59.093 bln
228.45%
jan 1, 1990
119.481 bln
+34.522 bln
40.63%
jan 1, 1991
74.616 bln
-44.865 bln
-37.55%
jan 1, 1992
82.543 bln
+7.927 bln
10.62%
jan 1, 1993
115.175 bln
+32.632 bln
39.53%
jan 1, 1994
210.539 bln
+95.364 bln
82.8%
jan 1, 1995
286.829 bln
+76.29 bln
36.24%
jan 1, 1996
184.227 bln
-102.602 bln
-35.77%
jan 1, 1997
177.506 bln
-6.721 bln
-3.65%
jan 1, 1998
170.826 bln
-6.68 bln
-3.76%
jan 1, 1999
160.37 bln
-10.456 bln
-6.12%
jan 1, 2000
764.684 bln
+604.314 bln
376.82%
jan 1, 2001
495.366 bln
-269.318 bln
-35.22%
jan 1, 2002
374.014 bln
-121.352 bln
-24.5%
jan 1, 2003
580.979 bln
+206.965 bln
55.34%
jan 1, 2004
457.214 bln
-123.766 bln
-21.3%
jan 1, 2005
525.823 bln
+68.61 bln
15.01%
jan 1, 2006
1.2 trl
+673.894 bln
128.16%
jan 1, 2007
1.339 trl
+139.554 bln
11.63%
jan 1, 2008
1.918 trl
+578.614 bln
43.2%
jan 1, 2009
1.187 trl
-730.664 bln
-38.1%
jan 1, 2010
1.685 trl
+498.236 bln
41.97%
jan 1, 2011
1.63 trl
-55.705 bln
-3.31%
jan 1, 2012
1.934 trl
+304.652 bln
18.69%
jan 1, 2013
1.585 trl
-349.731 bln
-18.08%
jan 1, 2014
1.33 trl
-254.823 bln
-16.08%
jan 1, 2015
1.284 trl
-46.152 bln
-3.47%
jan 1, 2016
1.844 trl
+560.032 bln
43.63%
Ranking of countries by current statistics by years


Comments: