29
/
en
AIzaSyAYiBZKx7MnpbEhh9jyipgxe19OcubqV5w
April 1, 2024
182581
Luxembourg
LUX
true
2
1
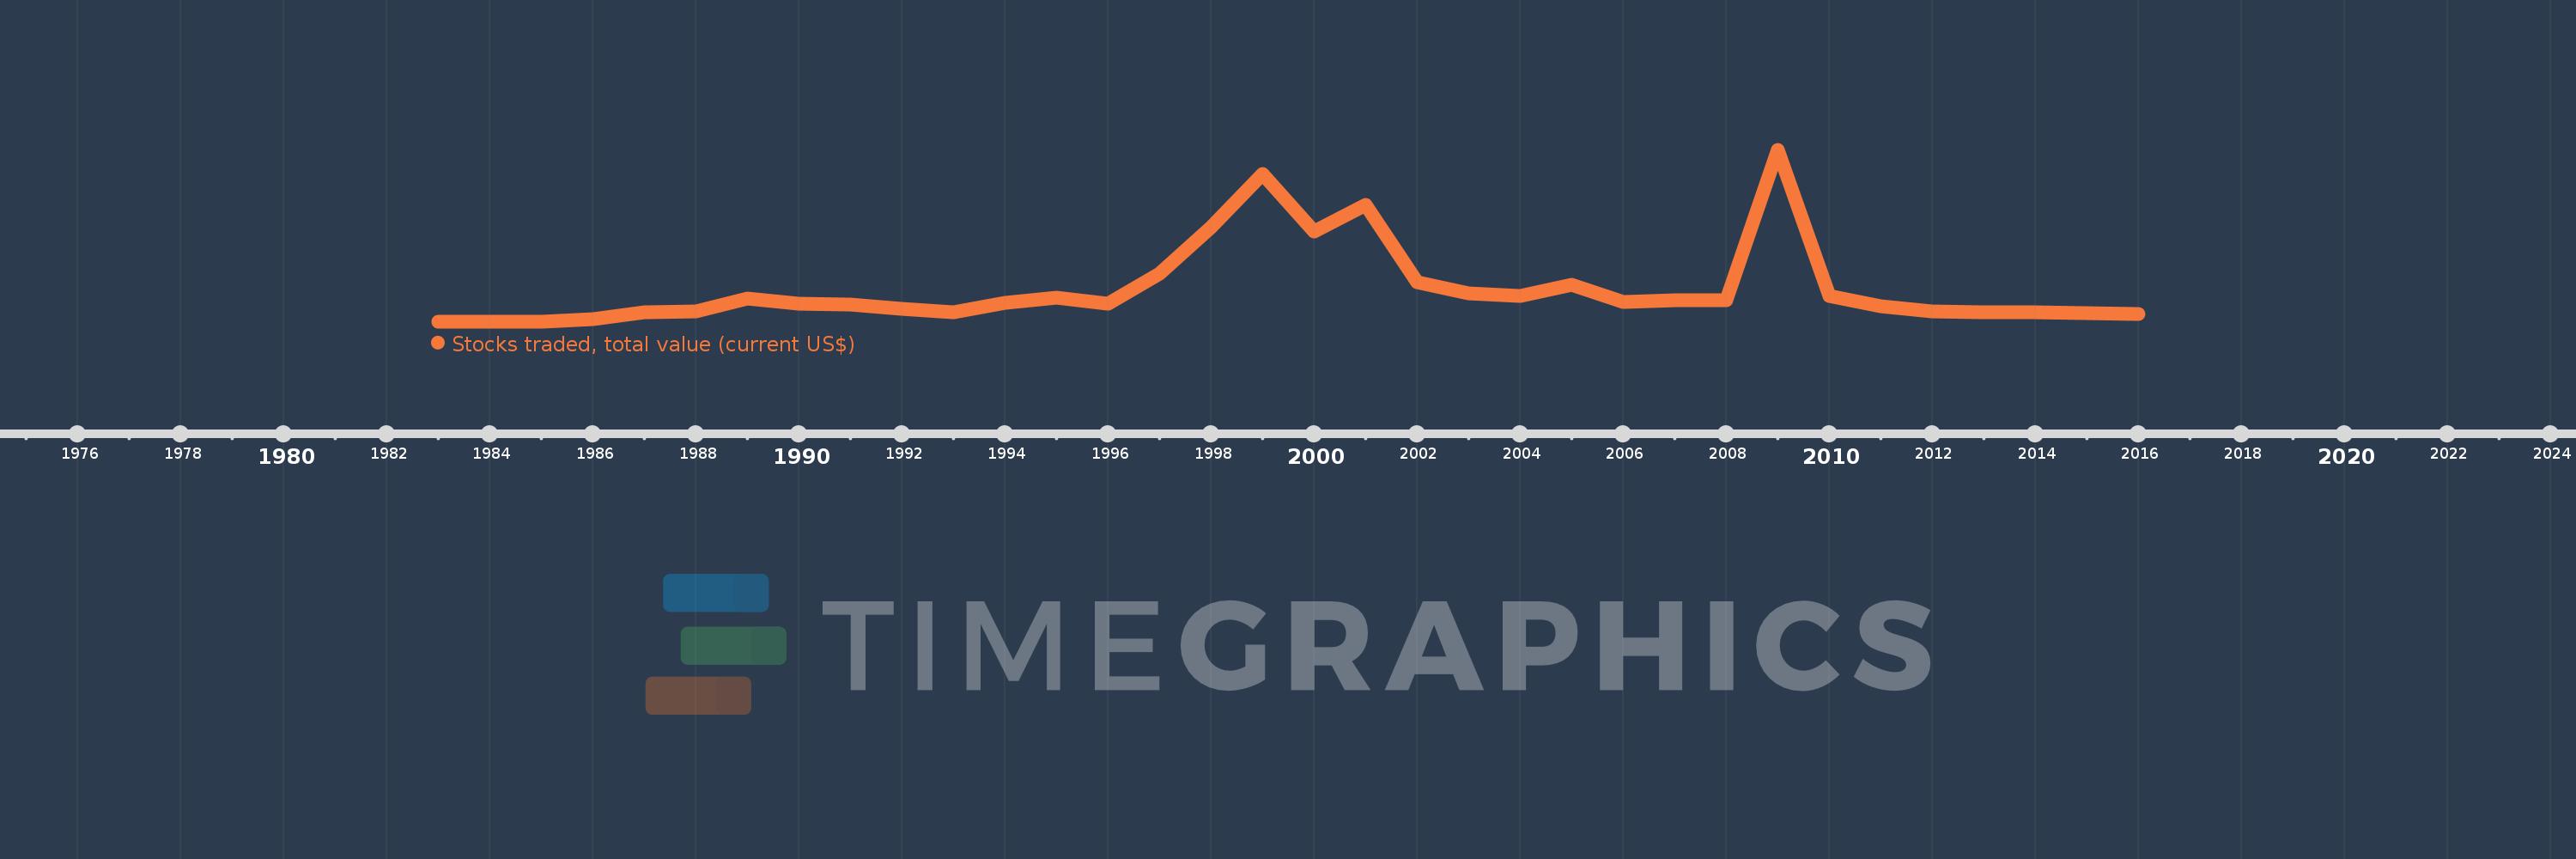
Stocks traded, total value (current US$)
2016,2015,2014,2013,2012,2011,2010,2009,2008,2007,2006,2005,2004,2003,2002,2001,2000,1999,1998,1997,1996,1995,1994,1993,1992,1991,1990,1989,1988,1987,1986,1985,1984,1983
This statistics in other country:
Timeline:
This timeline shows a graph from 1983 to 2016 of Luxembourg. No data until 1982. Number of actual observations by date: 34.
Source name:
World Development Indicators
Source organization:
World Federation of Exchanges database.
Categories, topics:
Financial Sector
Last updated:
apr 23, 2017
Indicators value changes by year
Minimum:
16.01 mln
jan 1, 1984
Maximum:
1.791 bln
jan 1, 2009
At the date of observation
Value
Absolute change
Change from previous value
jan 1, 1983
17.0 mln
+17.0 mln
0.0%
jan 1, 1984
16.01 mln
-990.0K
-5.82%
jan 1, 1985
20.14 mln
+4.13 mln
25.8%
jan 1, 1986
42.25 mln
+22.11 mln
109.78%
jan 1, 1987
120.31 mln
+78.06 mln
184.76%
jan 1, 1988
125.45 mln
+5.14 mln
4.27%
jan 1, 1989
255.12 mln
+129.67 mln
103.36%
jan 1, 1990
204.5 mln
-50.62 mln
-19.84%
jan 1, 1991
197.25 mln
-7.25 mln
-3.55%
jan 1, 1992
147.45 mln
-49.8 mln
-25.25%
jan 1, 1993
114.21 mln
-33.24 mln
-22.54%
jan 1, 1994
211.24 mln
+97.03 mln
84.96%
jan 1, 1995
268.84 mln
+57.6 mln
27.27%
jan 1, 1996
205.31 mln
-63.53 mln
-23.63%
jan 1, 1997
514.1 mln
+308.79 mln
150.4%
jan 1, 1998
995.52 mln
+481.42 mln
93.64%
jan 1, 1999
1.548 bln
+552.9 mln
55.54%
jan 1, 2000
951.19 mln
-597.23 mln
-38.57%
jan 1, 2001
1.222 bln
+271.23 mln
28.51%
jan 1, 2002
430.95 mln
-791.47 mln
-64.75%
jan 1, 2003
307.29 mln
-123.66 mln
-28.69%
jan 1, 2004
283.01 mln
-24.28 mln
-7.9%
jan 1, 2005
396.49 mln
+113.48 mln
40.1%
jan 1, 2006
226.7 mln
-169.79 mln
-42.82%
jan 1, 2007
240.37 mln
+13.67 mln
6.03%
jan 1, 2008
244.01 mln
+3.64 mln
1.51%
jan 1, 2009
1.791 bln
+1.547 bln
633.85%
jan 1, 2010
280.88 mln
-1.51 bln
-84.31%
jan 1, 2011
177.82 mln
-103.06 mln
-36.69%
jan 1, 2012
122.73 mln
-55.09 mln
-30.98%
jan 1, 2013
114.95 mln
-7.78 mln
-6.34%
jan 1, 2014
119.54 mln
+4.59 mln
3.99%
jan 1, 2015
110.45 mln
-9.09 mln
-7.6%
jan 1, 2016
95.95 mln
-14.5 mln
-13.13%
Ranking of countries by current statistics by years


Comments: