29
/
en
AIzaSyAYiBZKx7MnpbEhh9jyipgxe19OcubqV5w
April 1, 2024
125556
Egypt, Arab Rep.
EGY
true
2
1
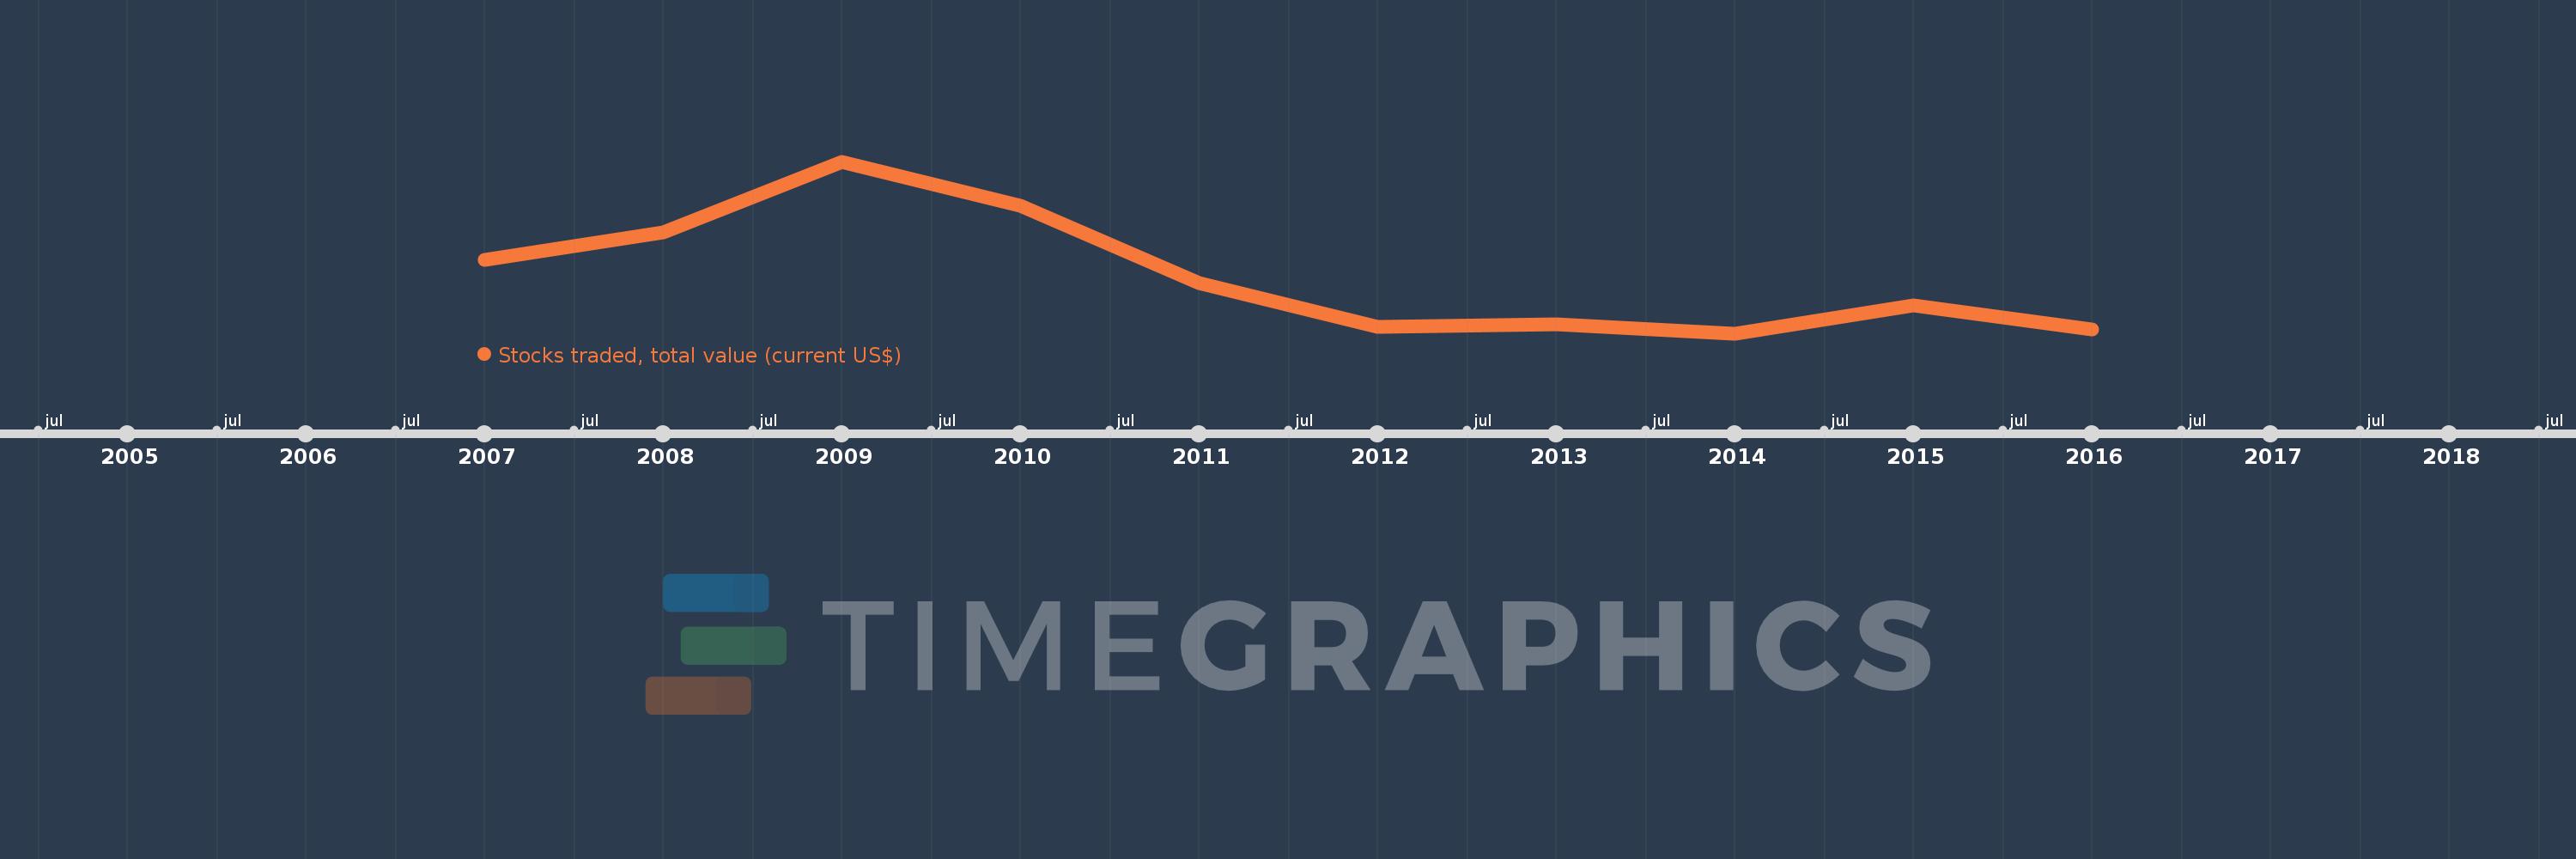
Stocks traded, total value (current US$)
2016,2015,2014,2013,2012,2011,2010,2009,2008,2007
This statistics in other country:
Timeline:
This timeline shows a graph from 2007 to 2016 of Egypt, Arab Rep.. No data until 2006. Number of actual observations by date: 10.
Source name:
World Development Indicators
Source organization:
World Federation of Exchanges database.
Categories, topics:
Financial Sector
Last updated:
apr 23, 2017
Indicators value changes by year
Minimum:
12.735 bln
jan 1, 2014
Maximum:
95.827 bln
jan 1, 2009
At the date of observation
Value
Absolute change
Change from previous value
jan 1, 2007
48.364 bln
+48.364 bln
0.0%
jan 1, 2008
61.518 bln
+13.154 bln
27.2%
jan 1, 2009
95.827 bln
+34.309 bln
55.77%
jan 1, 2010
74.374 bln
-21.452 bln
-22.39%
jan 1, 2011
37.215 bln
-37.159 bln
-49.96%
jan 1, 2012
15.898 bln
-21.318 bln
-57.28%
jan 1, 2013
17.093 bln
+1.196 bln
7.52%
jan 1, 2014
12.735 bln
-4.358 bln
-25.5%
jan 1, 2015
26.441 bln
+13.706 bln
107.62%
jan 1, 2016
14.76 bln
-11.681 bln
-44.18%
Ranking of countries by current statistics by years


Comments: