29
/
en
AIzaSyAYiBZKx7MnpbEhh9jyipgxe19OcubqV5w
April 1, 2024
48568
Middle East & North Africa
MEA
false
2
1
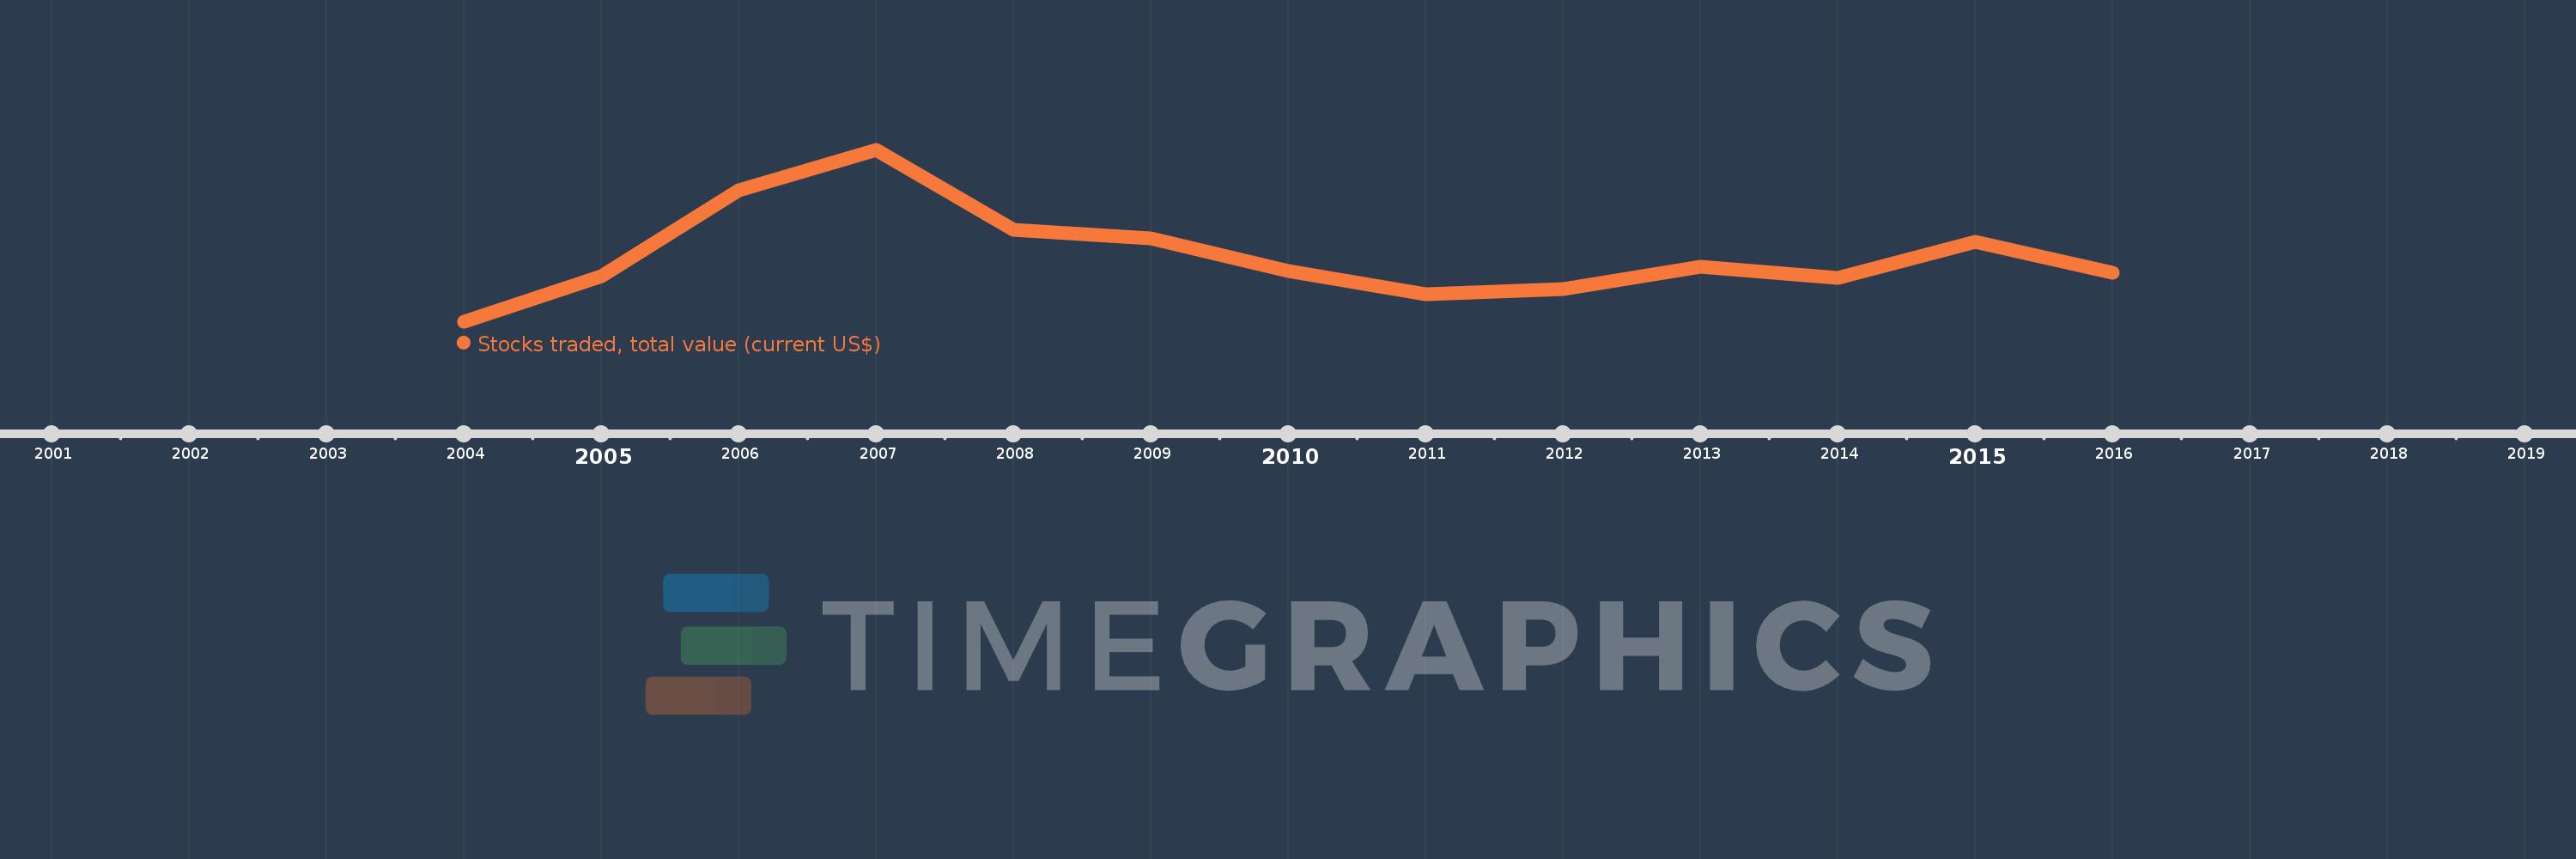
Stocks traded, total value (current US$)
2016,2015,2014,2013,2012,2011,2010,2009,2008,2007,2006,2005,2004
This statistics in other country:
Timeline:
This timeline shows a graph from 2004 to 2016 of Middle East & North Africa. No data until 2003. Number of actual observations by date: 13.
Source name:
World Development Indicators
Source organization:
World Federation of Exchanges database.
Categories, topics:
Financial Sector
Last updated:
apr 23, 2017
Indicators value changes by year
Minimum:
193.031 bln
jan 1, 2004
Maximum:
1.654 trl
jan 1, 2007
At the date of observation
Value
Absolute change
Change from previous value
jan 1, 2004
193.031 bln
+193.031 bln
0.0%
jan 1, 2005
579.192 bln
+386.161 bln
200.05%
jan 1, 2006
1.311 trl
+731.732 bln
126.34%
jan 1, 2007
1.654 trl
+342.961 bln
26.16%
jan 1, 2008
978.959 bln
-674.926 bln
-40.81%
jan 1, 2009
903.563 bln
-75.397 bln
-7.7%
jan 1, 2010
625.748 bln
-277.814 bln
-30.75%
jan 1, 2011
432.193 bln
-193.556 bln
-30.93%
jan 1, 2012
470.275 bln
+38.082 bln
8.81%
jan 1, 2013
664.371 bln
+194.097 bln
41.27%
jan 1, 2014
571.314 bln
-93.058 bln
-14.01%
jan 1, 2015
877.026 bln
+305.712 bln
53.51%
jan 1, 2016
609.004 bln
-268.021 bln
-30.56%
Ranking of countries by current statistics by years


Comments: