29
/
en
AIzaSyAYiBZKx7MnpbEhh9jyipgxe19OcubqV5w
April 1, 2024
263014
Thailand
THA
true
2
1
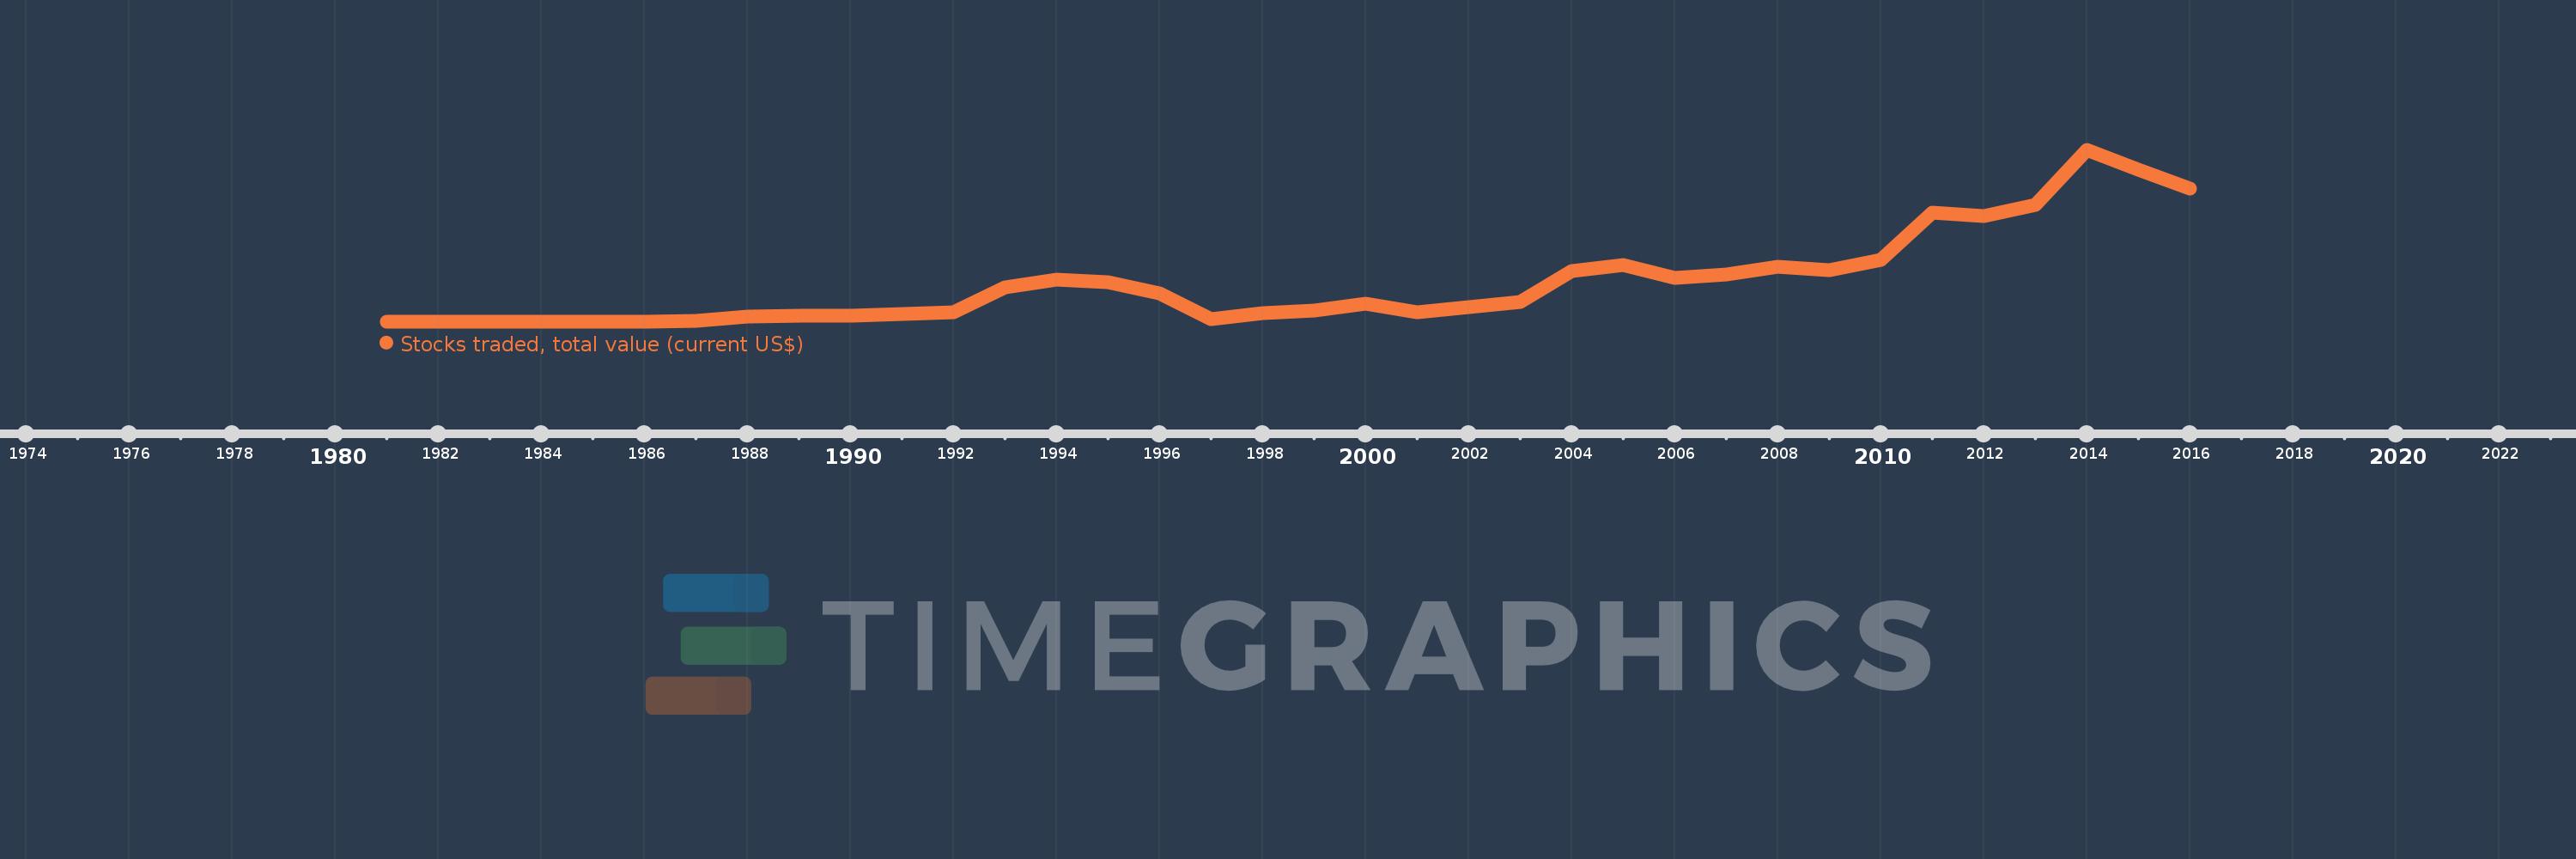
Stocks traded, total value (current US$)
2016,2015,2014,2013,2012,2011,2010,2009,2008,2007,2006,2005,2004,2003,2002,2001,2000,1999,1998,1997,1996,1995,1994,1993,1992,1991,1990,1989,1988,1987,1986,1985,1984,1983,1982,1981
This statistics in other country:
Timeline:
This timeline shows a graph from 1981 to 2016 of Thailand. No data until 1980. Number of actual observations by date: 36.
Source name:
World Development Indicators
Source organization:
World Federation of Exchanges database.
Categories, topics:
Financial Sector
Last updated:
apr 23, 2017
Indicators value changes by year
Minimum:
233.0 mln
jan 1, 1982
Maximum:
349.912 bln
jan 1, 2014
At the date of observation
Value
Absolute change
Change from previous value
jan 1, 1981
693.0 mln
+693.0 mln
0.0%
jan 1, 1982
233.0 mln
-460.0 mln
-66.38%
jan 1, 1983
555.0 mln
+322.0 mln
138.2%
jan 1, 1984
794.0 mln
+239.0 mln
43.06%
jan 1, 1985
936.0 mln
+142.0 mln
17.88%
jan 1, 1986
1.323 bln
+387.0 mln
41.35%
jan 1, 1987
2.202 bln
+879.0 mln
66.44%
jan 1, 1988
10.797 bln
+8.595 bln
390.33%
jan 1, 1989
13.116 bln
+2.319 bln
21.48%
jan 1, 1990
12.722 bln
-394.3 mln
-3.01%
jan 1, 1991
15.736 bln
+3.015 bln
23.7%
jan 1, 1992
19.401 bln
+3.664 bln
23.29%
jan 1, 1993
71.445 bln
+52.044 bln
268.26%
jan 1, 1994
87.102 bln
+15.657 bln
21.91%
jan 1, 1995
81.035 bln
-6.068 bln
-6.97%
jan 1, 1996
58.914 bln
-22.121 bln
-27.3%
jan 1, 1997
6.674 bln
-52.24 bln
-88.67%
jan 1, 1998
17.655 bln
+10.981 bln
164.55%
jan 1, 1999
22.671 bln
+5.016 bln
28.41%
jan 1, 2000
37.307 bln
+14.637 bln
64.56%
jan 1, 2001
19.331 bln
-17.976 bln
-48.18%
jan 1, 2002
31.051 bln
+11.72 bln
60.63%
jan 1, 2003
41.28 bln
+10.23 bln
32.94%
jan 1, 2004
104.55 bln
+63.269 bln
153.27%
jan 1, 2005
116.937 bln
+12.387 bln
11.85%
jan 1, 2006
89.82 bln
-27.117 bln
-23.19%
jan 1, 2007
97.01 bln
+7.19 bln
8.0%
jan 1, 2008
112.751 bln
+15.742 bln
16.23%
jan 1, 2009
106.058 bln
-6.694 bln
-5.94%
jan 1, 2010
126.621 bln
+20.564 bln
19.39%
jan 1, 2011
222.431 bln
+95.81 bln
75.67%
jan 1, 2012
215.271 bln
-7.16 bln
-3.22%
jan 1, 2013
238.851 bln
+23.58 bln
10.95%
jan 1, 2014
349.912 bln
+111.06 bln
46.5%
jan 1, 2015
310.64 bln
-39.272 bln
-11.22%
jan 1, 2016
271.317 bln
-39.323 bln
-12.66%
Ranking of countries by current statistics by years


Comments: