29
/
en
AIzaSyAYiBZKx7MnpbEhh9jyipgxe19OcubqV5w
April 1, 2024
243150
Slovenia
SVN
true
2
1
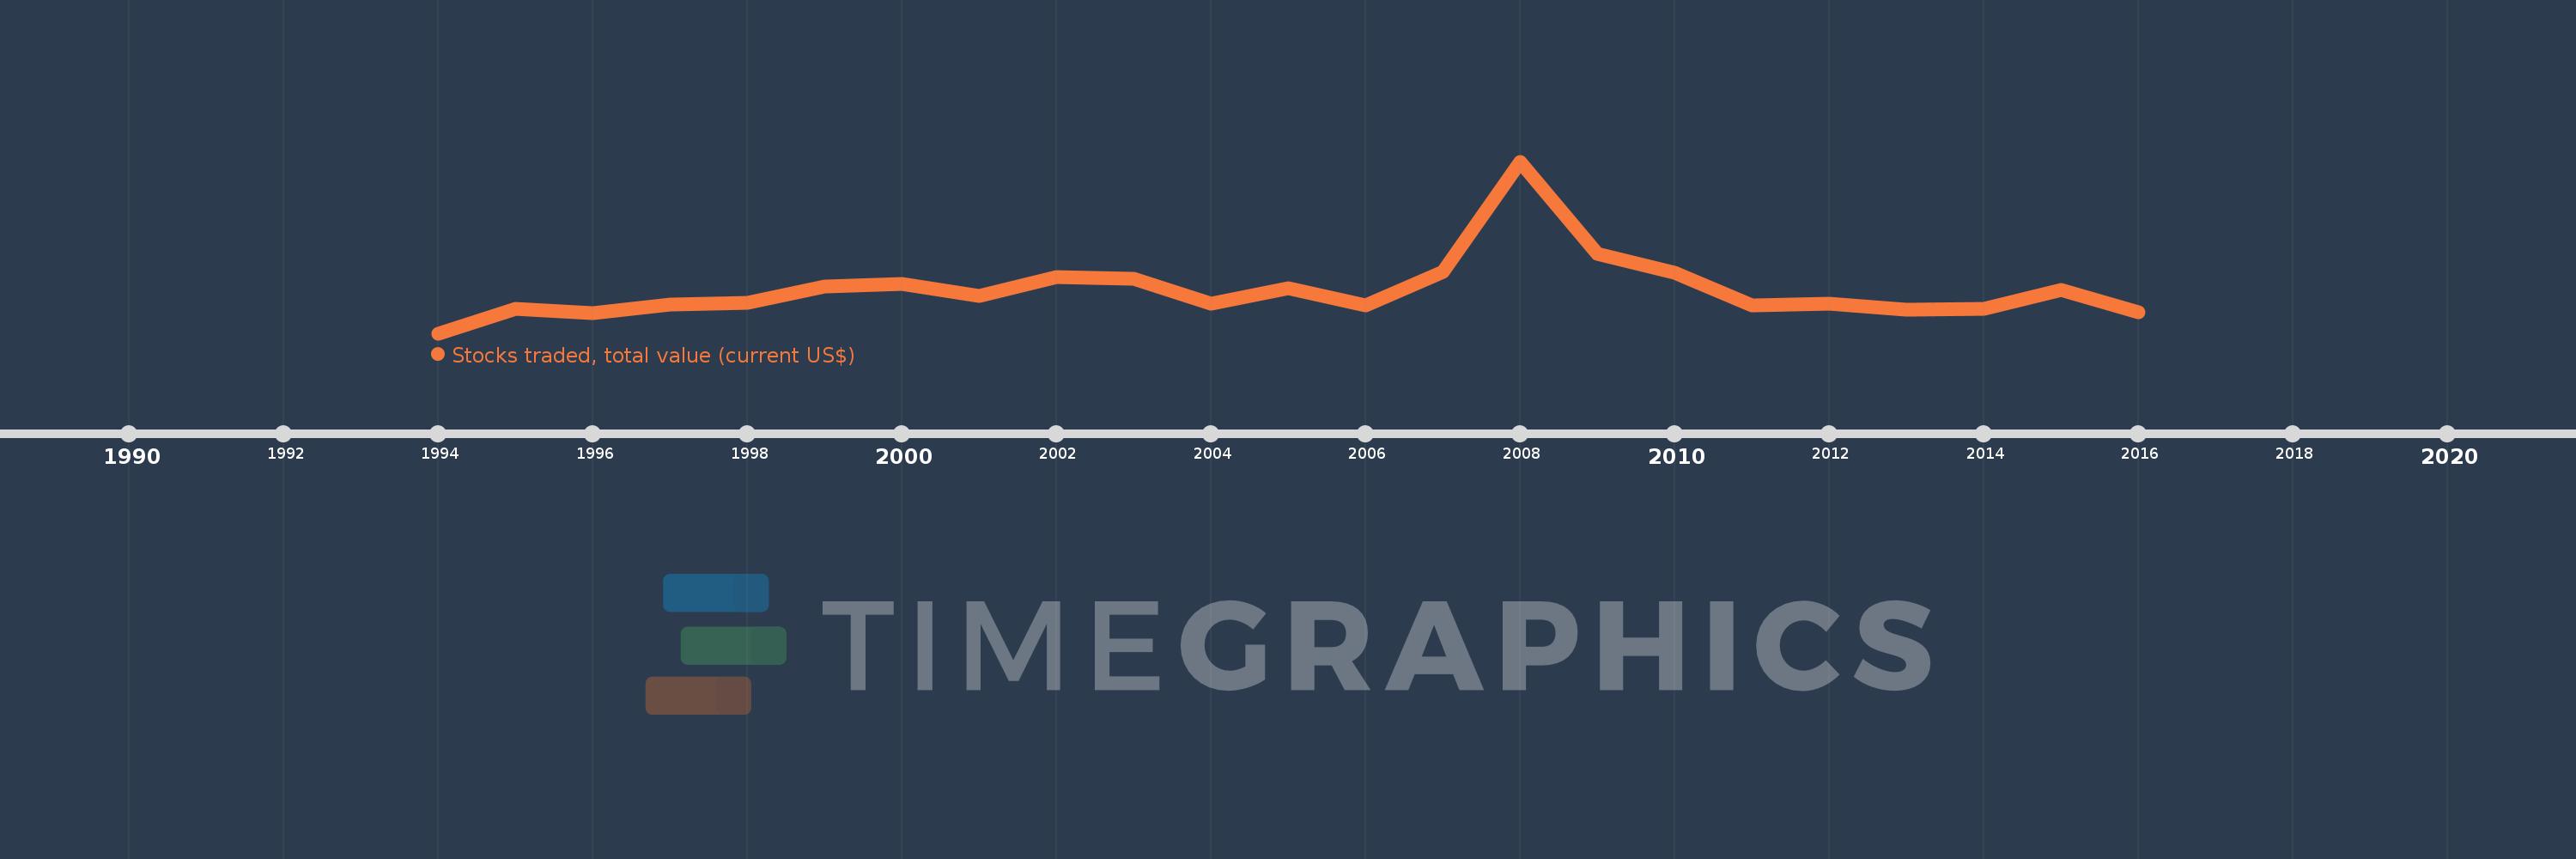
Stocks traded, total value (current US$)
2016,2015,2014,2013,2012,2011,2010,2009,2008,2007,2006,2005,2004,2003,2002,2001,2000,1999,1998,1997,1996,1995,1994
This statistics in other country:
Timeline:
This timeline shows a graph from 1994 to 2016 of Slovenia. No data until 1993. Number of actual observations by date: 23.
Source name:
World Development Indicators
Source organization:
World Federation of Exchanges database.
Categories, topics:
Financial Sector
Last updated:
apr 23, 2017
Indicators value changes by year
Minimum:
400.0K
jan 1, 1994
Maximum:
2.937 bln
jan 1, 2008
At the date of observation
Value
Absolute change
Change from previous value
jan 1, 1994
400.0K
+400.0K
0.0%
jan 1, 1995
416.6 mln
+416.2 mln
104.05K%
jan 1, 1996
348.1 mln
-68.5 mln
-16.44%
jan 1, 1997
494.1 mln
+146.0 mln
41.94%
jan 1, 1998
519.74 mln
+25.64 mln
5.19%
jan 1, 1999
806.05 mln
+286.31 mln
55.09%
jan 1, 2000
848.37 mln
+42.32 mln
5.25%
jan 1, 2001
638.86 mln
-209.51 mln
-24.7%
jan 1, 2002
965.68 mln
+326.82 mln
51.16%
jan 1, 2003
926.52 mln
-39.16 mln
-4.06%
jan 1, 2004
500.24 mln
-426.28 mln
-46.01%
jan 1, 2005
771.26 mln
+271.02 mln
54.18%
jan 1, 2006
476.05 mln
-295.21 mln
-38.28%
jan 1, 2007
1.056 bln
+580.32 mln
121.9%
jan 1, 2008
2.937 bln
+1.88 bln
177.99%
jan 1, 2009
1.352 bln
-1.584 bln
-53.95%
jan 1, 2010
1.033 bln
-319.46 mln
-23.62%
jan 1, 2011
484.04 mln
-548.82 mln
-53.14%
jan 1, 2012
512.1 mln
+28.06 mln
5.8%
jan 1, 2013
399.91 mln
-112.19 mln
-21.91%
jan 1, 2014
412.58 mln
+12.67 mln
3.17%
jan 1, 2015
735.84 mln
+323.26 mln
78.35%
jan 1, 2016
364.53 mln
-371.31 mln
-50.46%
Ranking of countries by current statistics by years


Comments: