29
/
en
AIzaSyAYiBZKx7MnpbEhh9jyipgxe19OcubqV5w
April 1, 2024
227902
Qatar
QAT
true
2
1
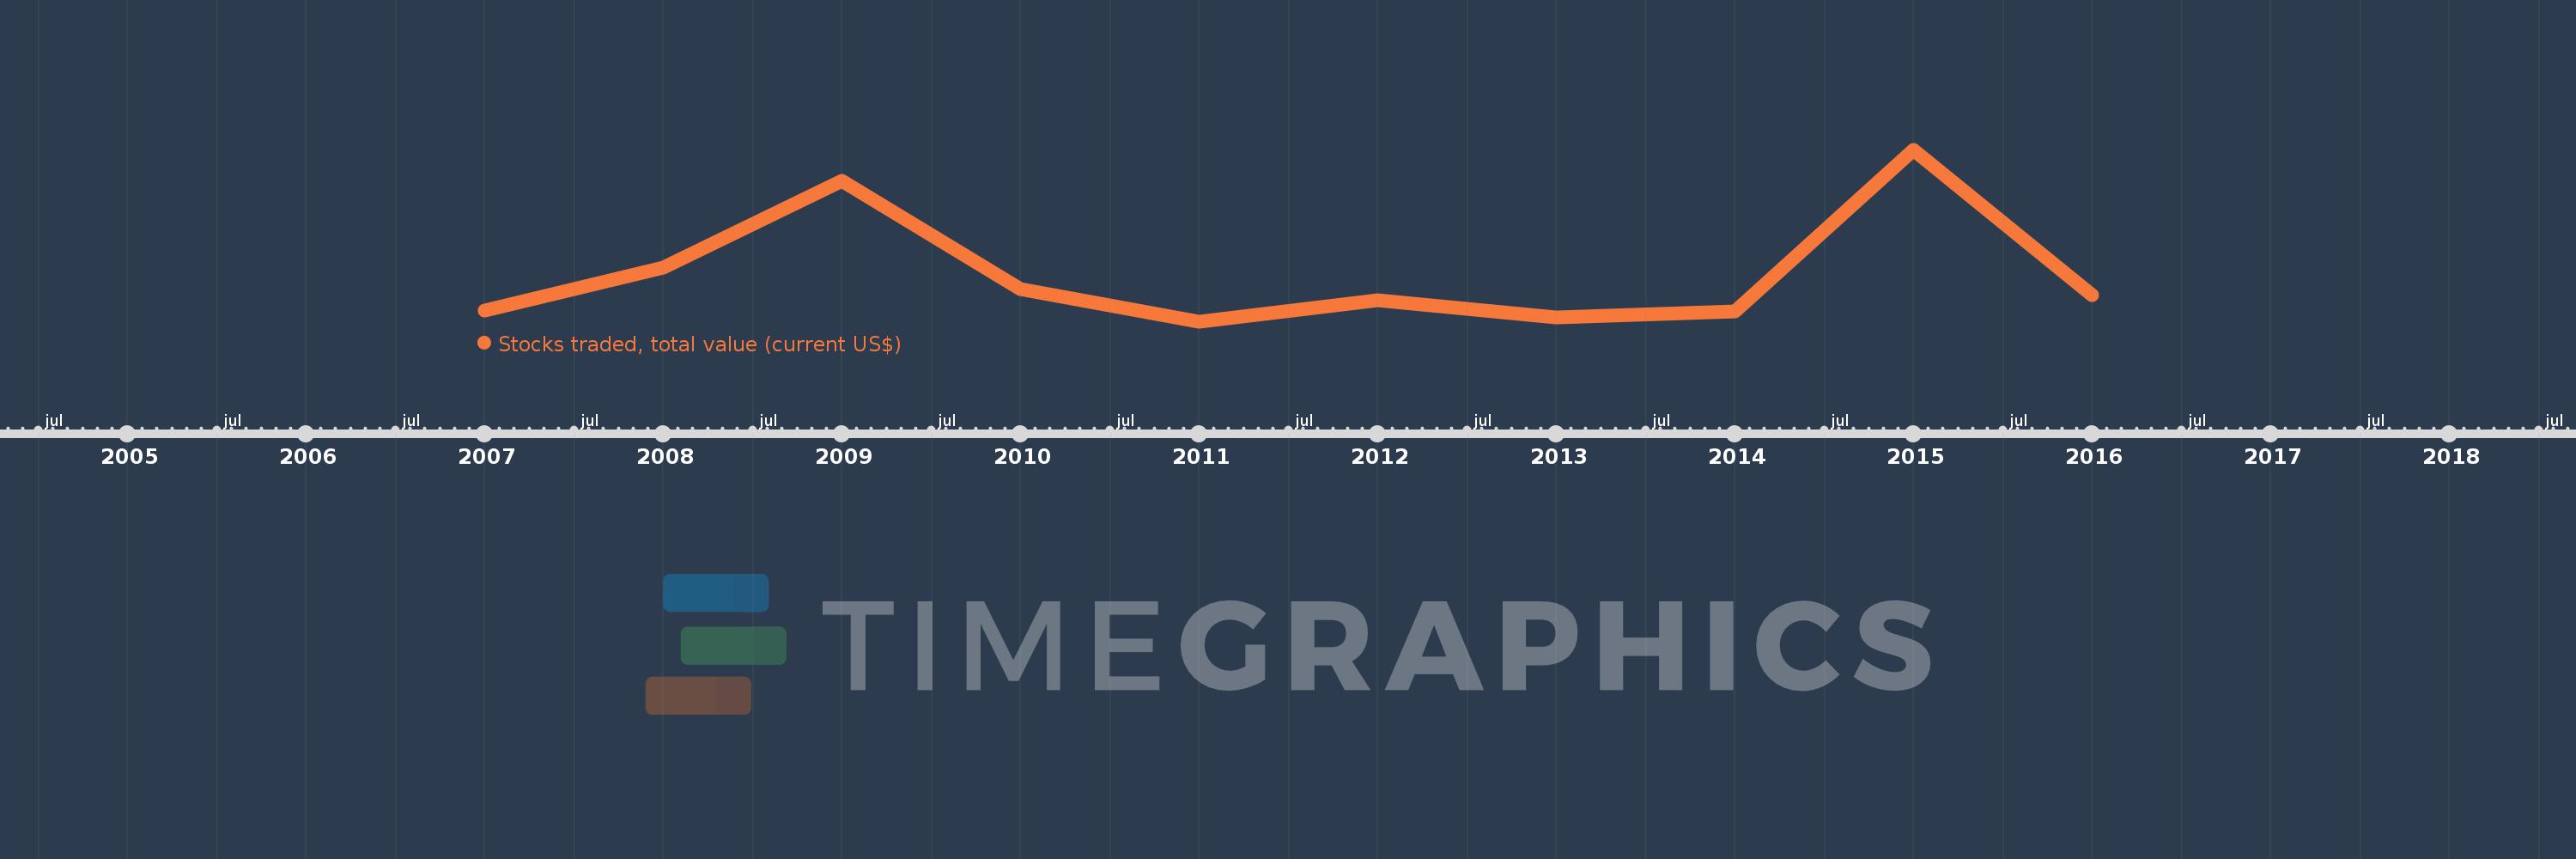
Stocks traded, total value (current US$)
2016,2015,2014,2013,2012,2011,2010,2009,2008,2007
This statistics in other country:
Timeline:
This timeline shows a graph from 2007 to 2016 of Qatar. No data until 2006. Number of actual observations by date: 10.
Source name:
World Development Indicators
Source organization:
World Federation of Exchanges database.
Categories, topics:
Financial Sector
Last updated:
apr 23, 2017
Indicators value changes by year
Minimum:
18.401 bln
jan 1, 2011
Maximum:
54.73 bln
jan 1, 2015
At the date of observation
Value
Absolute change
Change from previous value
jan 1, 2007
20.754 bln
+20.754 bln
0.0%
jan 1, 2008
29.94 bln
+9.186 bln
44.26%
jan 1, 2009
48.186 bln
+18.246 bln
60.94%
jan 1, 2010
25.319 bln
-22.867 bln
-47.46%
jan 1, 2011
18.401 bln
-6.918 bln
-27.32%
jan 1, 2012
22.909 bln
+4.507 bln
24.49%
jan 1, 2013
19.41 bln
-3.499 bln
-15.27%
jan 1, 2014
20.565 bln
+1.155 bln
5.95%
jan 1, 2015
54.73 bln
+34.165 bln
166.14%
jan 1, 2016
24.152 bln
-30.578 bln
-55.87%
Ranking of countries by current statistics by years


Comments: